
 Puffer
 Bitcoin
 ZKsync
 NEAR Protocol
 Walrus
 Pearl
Pearl Ondo
Ondo
Key Insights:
- Analyst Ali Martinez links LINK’s MVRV drop to past rebounds as whales accumulate more.
- Chainlink’s address growth rises as network trends shift, signaling increased adoption.
- Chainlink leads Real World Asset development, ranking first in activity over 30 days.
Chainlink price has exhibited intraday volatility, with its price oscillating between $17.30 and $18.40 in the past 24 hours. At present, LINK is trading around $18.00, showing mild recovery from previous lows but maintaining a choppy market structure.
Over the last 24 hours, the token has decreased by 0.3%, while its seven-day performance reflects a 3.0% decline, signaling short-term bearish conditions. A broader 14-day trend reveals a 7.7% drop, suggesting an extended correction phase. However, a 0.3% increase on the one-hour chart points to a potential short-term rebound.
Activity and Whale Accumulation
Amid price fluctuations, analyst Ali Martinez noted that Chainlink Price has declined nearly 40% over the past month. This decline aligns with a network contraction, signaling reduced activity within the Chainlink ecosystem.
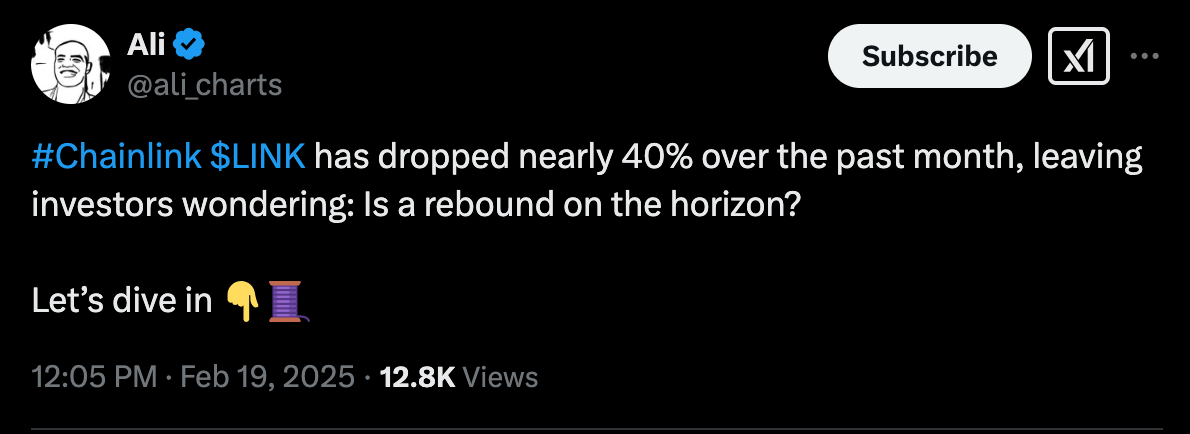
Martinez highlighted that LINK’s Market Value to Realized Value (MVRV) ratio currently stands at -16.3%, a level historically linked to selling exhaustion. In previous instances where the MVRV ratio dropped below -16%, Chainlink price experienced rebounds of 312%, 64%, 61%, 25%, and 52%.
Over the last 24 hours, large holders have acquired more than $20 million worth of LINK, indicating renewed confidence.
Martinez noted that for Chainlink’s price to confirm a recovery, it must surpass the $19 resistance level, with an upside target of $23.70. However, if LINK fails to maintain support at $15.50, a deeper correction could follow.
Chainlink Address Growth
Data from IntoTheBlock reflects shifting network trends, with key address metrics indicating a potential shift in market dynamics. Over the past seven days, new LINK addresses have increased by 6.08%, signaling growing adoption.
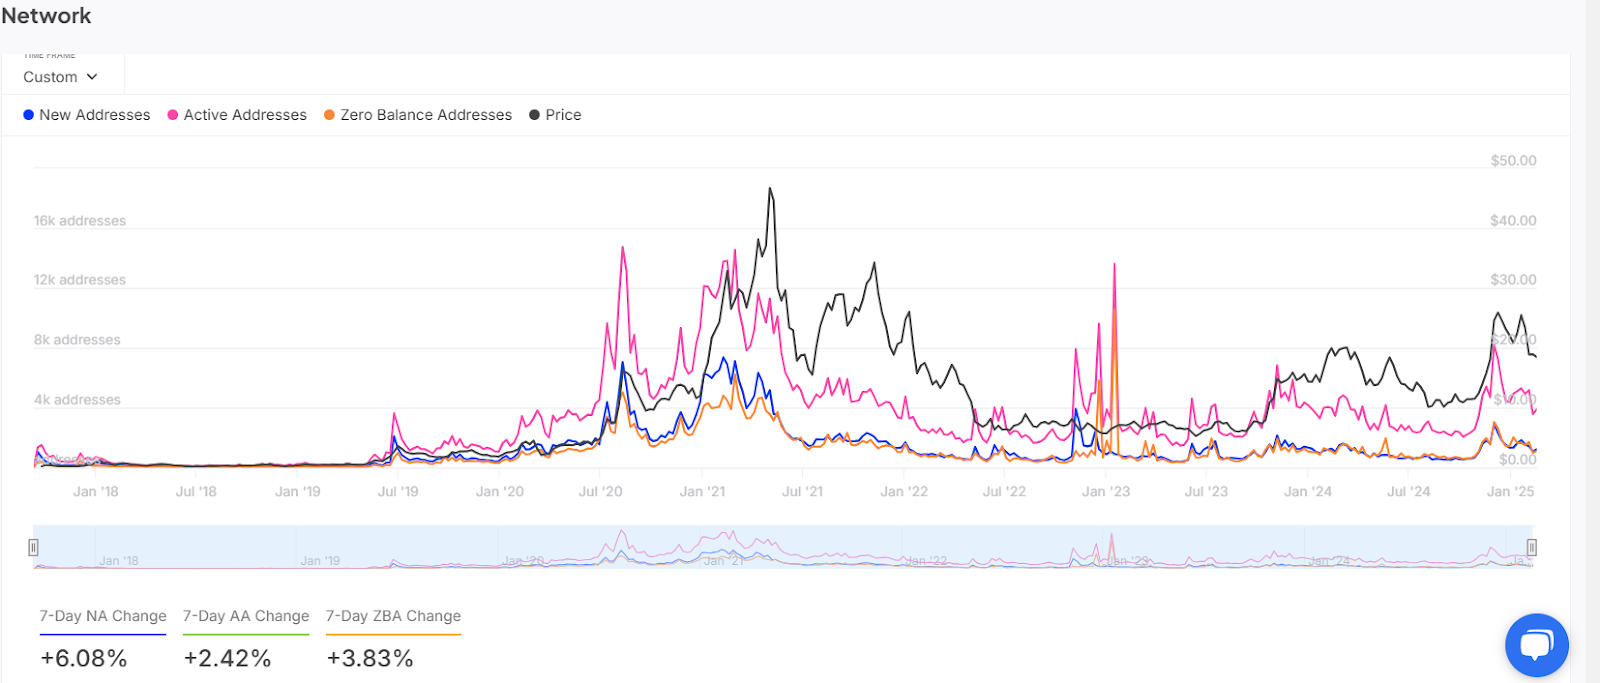
Active addresses have risen by 2.42%, suggesting increased network engagement, while zero-balance addresses have grown by 3.83%, potentially indicating recent asset movements.
Large Investors Dominate Chainlink
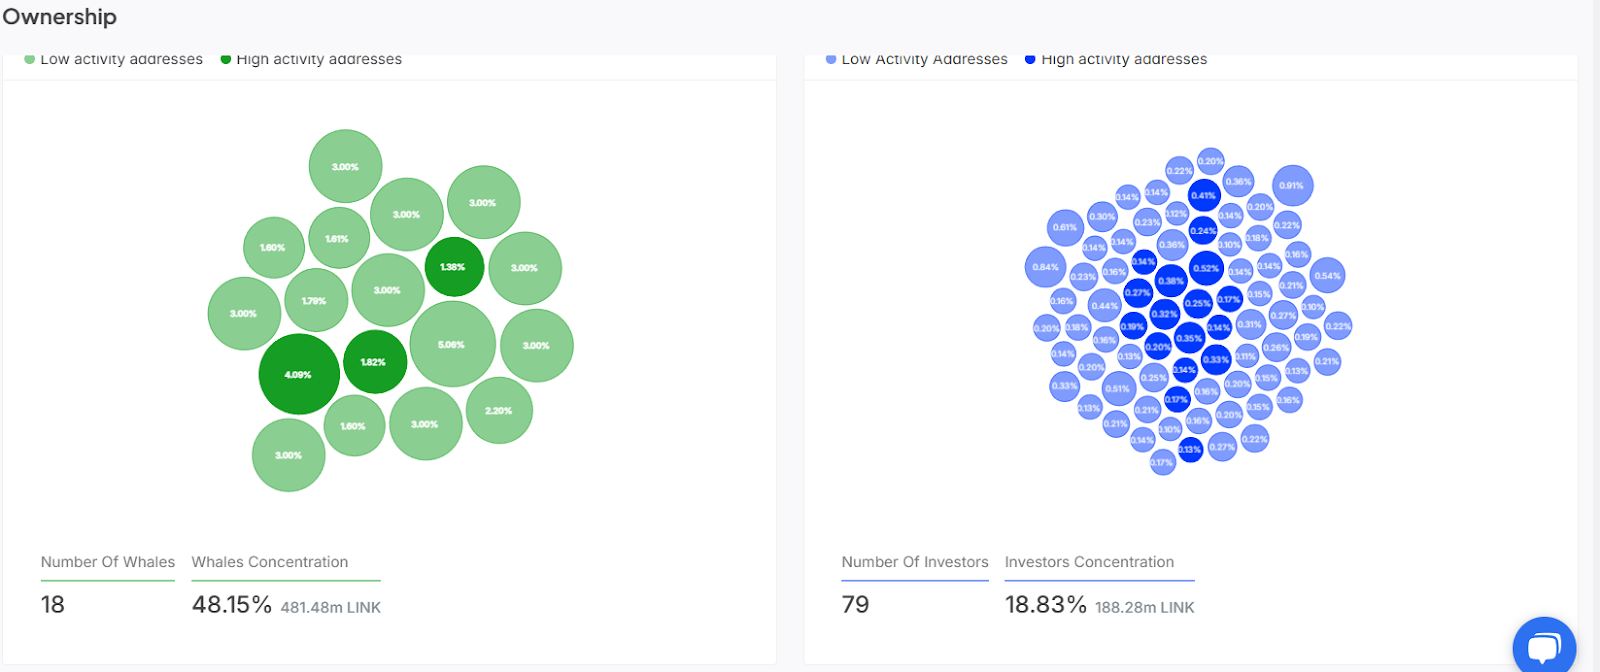
Ownership data also show that big investors hold stronger market power. The 481.48 million LINK held by the 18 whale addresses constitutes 48.15% of Chainlink’s circulating supply.
The 79 medium-sized investors operate independently, with 188.28 million LINK under management. This is 18.83% of the total market share.
Chainlink Tops RWA Development Activity
It is important to note that Chainlink leads all development activity in the Real World Asset sector, according to data from Santiment. The data positions LINK as number one in development with 669.2 points for the last 30 days. The development score for Chainlink stands three times higher than Synthetix‘s 221.6, which holds the second position.
Dusk holds the third spot with development activity standing at 48.13. Other tokens such as Reserve and Centrifuge are also shown on the list with high develeploment activity.
Disclaimer
In this article, the views and opinions stated by the author or any people named are for informational purposes only, and they don’t establish the investment, financial, or any other advice. Trading or investing in cryptocurrency assets comes with a risk of financial loss.



