
 Pearl
Pearl ZKsync
 Bitcoin
 Starknet
 Quantus
 Puffer
 Lighter

Key Insights:
- ETH/BTC RSI touches long-term trendline last seen before past rallies
- Ethereum trades below its $2,000 realized price for the first time since 2020
- Exchange reserves hit 18.6M ETH, lowest level since mid-2021
The ETH/BTC RSI is showing a repeated long-term pattern and the token is trading below its realized price of $2,000. With falling exchange reserves, these signs suggest that ETH price could soon reverse its downward trend.
ETH/BTC Pair Shows Pattern Repeating from Past Lows
The ETH/BTC chart below, by analyst Titan of Crypto, shows ETH price in relation to Bitcoin. It also has a Relative Strength Index (RSI) that measures market momentum. As can be seen, the RSI has been forming a series of higher lows since 2016, each of which is marked by a yellow circle.
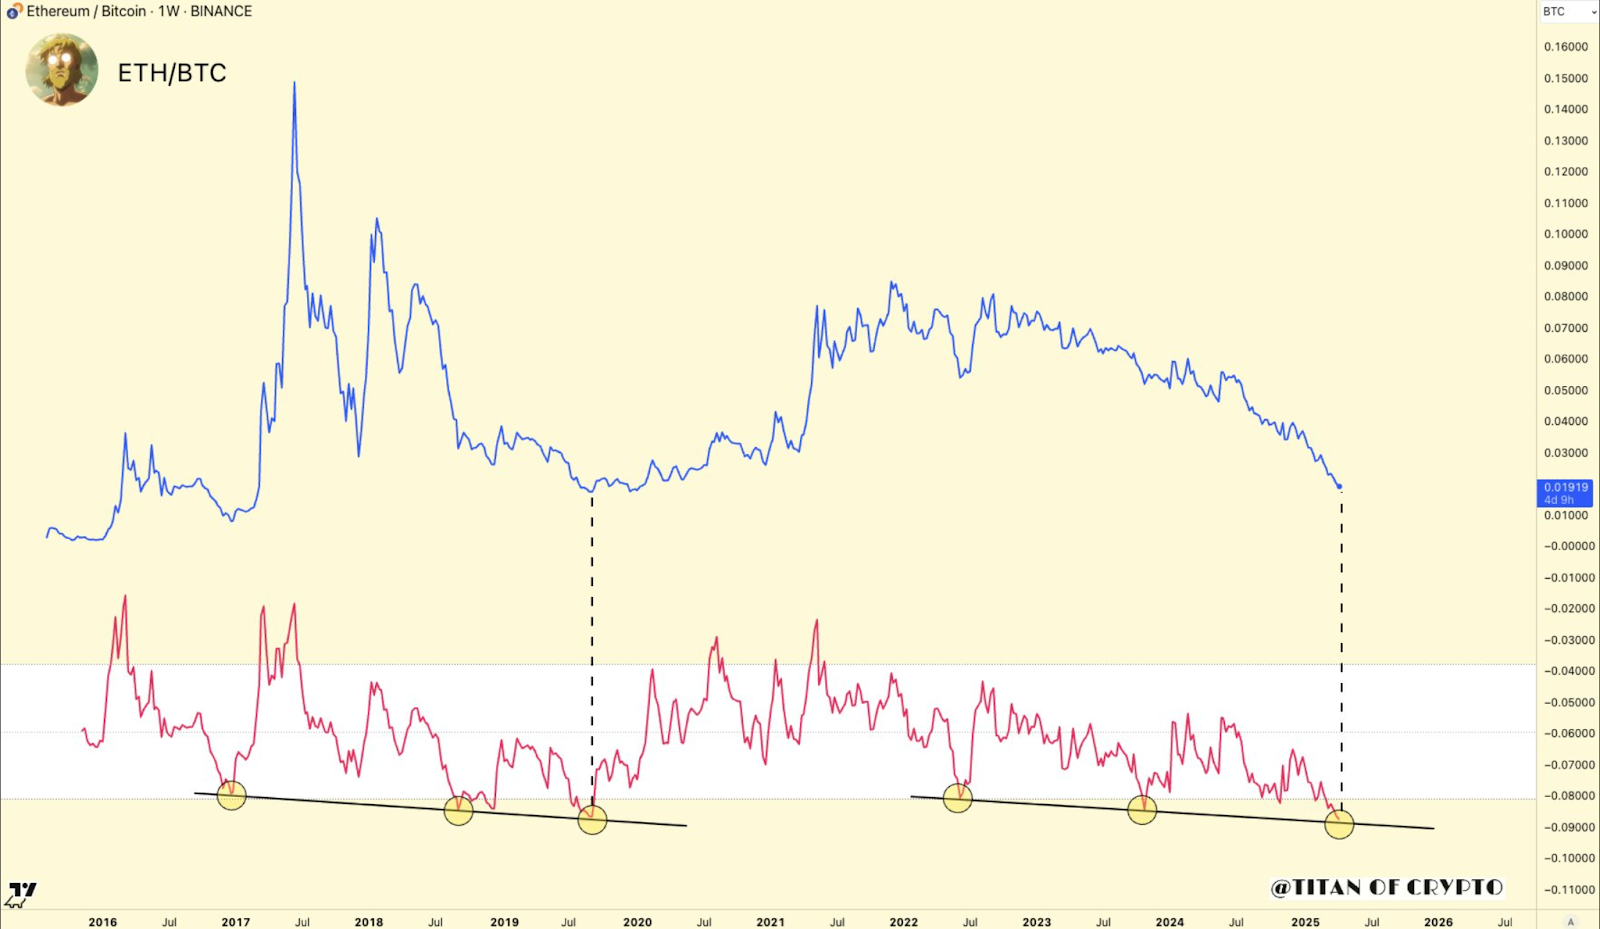
Every time this RSI trendline was touched, it was followed by a sharp upward move in ETH’s price relative to BTC. The first low was in early 2017, the second around mid-2018, and the third at mid-2022. The RSI is now back on this trendline support in April 2025.
The ETH/BTC pair has dropped to 0.01919, but previous RSI patterns suggest this level has often signified a bottom. This observation is backed by a consistent RSI trend over several years, but there is no guarantee of an outcome.
ETH Price Drops Below Realized Price Level
Additionally, CryptoRank has published a chart comparing Ethereum’s current price to its realized price, or the average value at which all ETH coins last moved. Currently, the token’s market price is below its realized price, estimated at around $2,000. Ethereum is currently trading near $1,660.
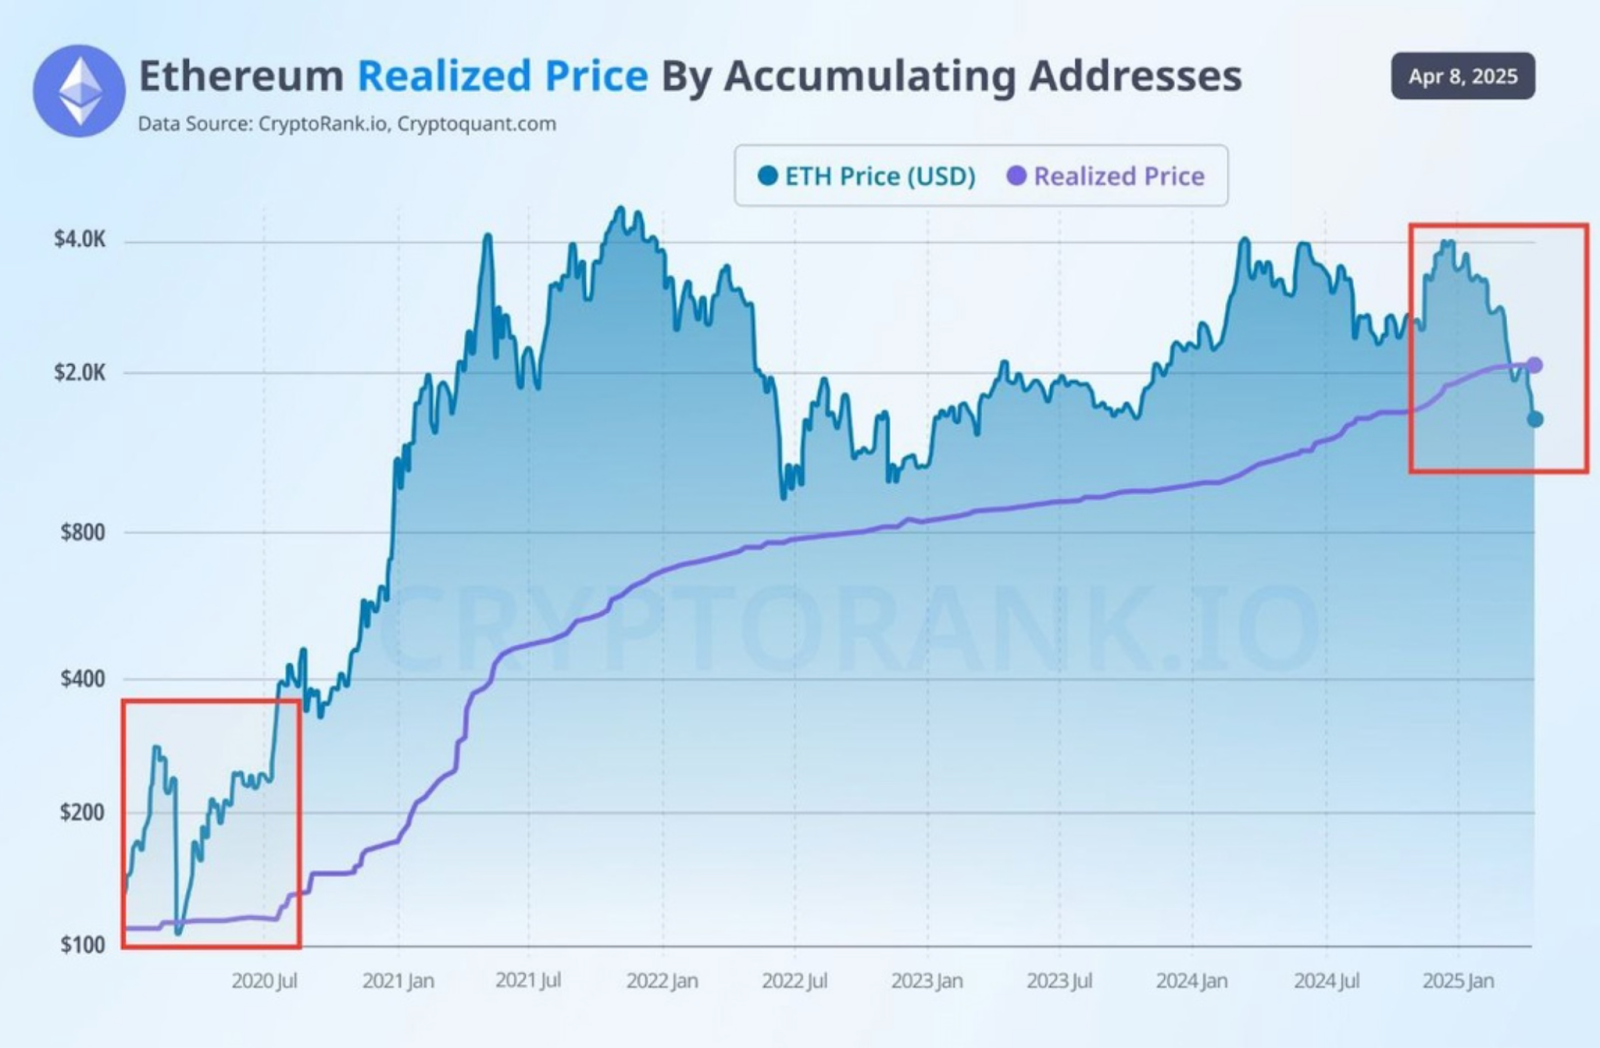
This is a rare event that has happened only a few times before. The last time it happened was in March 2020, when ETH price fell from $283 to $109.
After that, the market quickly recovered and started a long upward trend. If buyers come in while prices stay under this key threshold, the scenario could play out again.
It often means that the holders are at a loss when the price is under the realized price. If long-term investors start to accumulate, this could be a market bottom.
Exchange Reserves Continue to Fall as ETH Price Declines
Meanwhile, CryptoQuant data shows Ethereum’s exchange reserves across all platforms. This data shows how much ETH is held on exchanges and is often a good indicator of whether investors are looking to sell or hold.
Since mid-2021, exchange reserves have been steadily dropping from over 30 million ETH to 18.6 million ETH in April 2025.
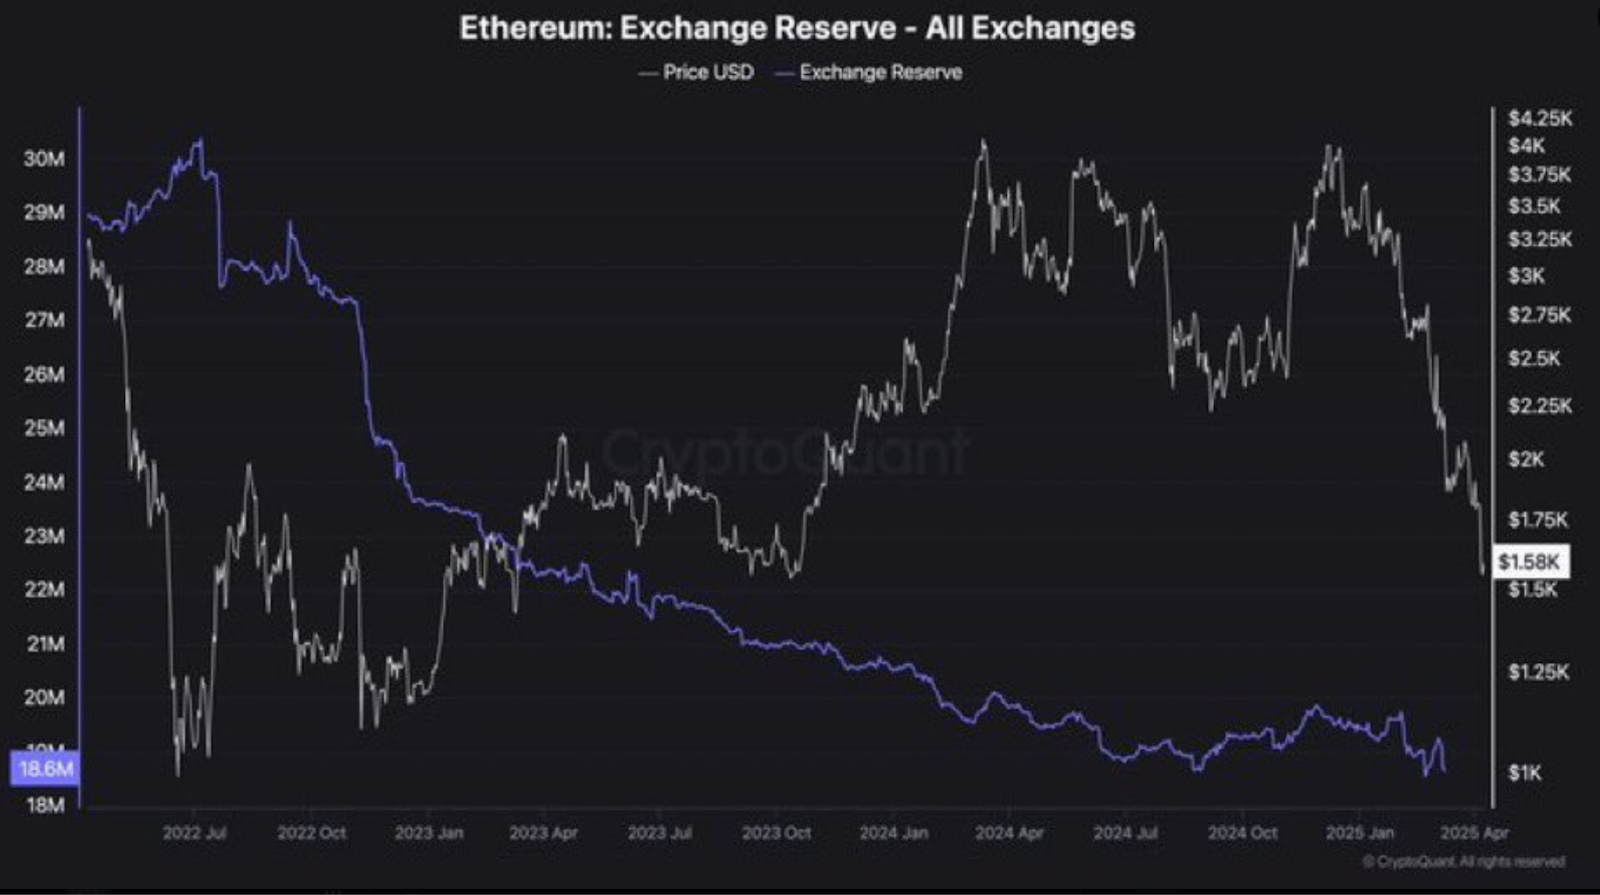
However, the ETH price has plummeted. If the price falls and the exchange reserves drop, there may be fewer sellers left. And as reserves fall, it can cause a “supply shock” as there are fewer coins to buy.
Analyst UfoCalls says, “A supply shock is coming soon now for Ethereum. The token will easily 5x from here.” It is consistent with expectations of robust demand if market sentiment improves.
Liquidation Map Points to High Short Interest Near Current Prices
Furthermore, Coinglass’ liquidation heatmap details show where long and short trades are placed and at what price levels liquidation could occur.
The red dashed line shows that Ethereum’s current price is around $1,660. Below this level there is heavy cumulative short leverage, especially between $1,400 and $1,600.
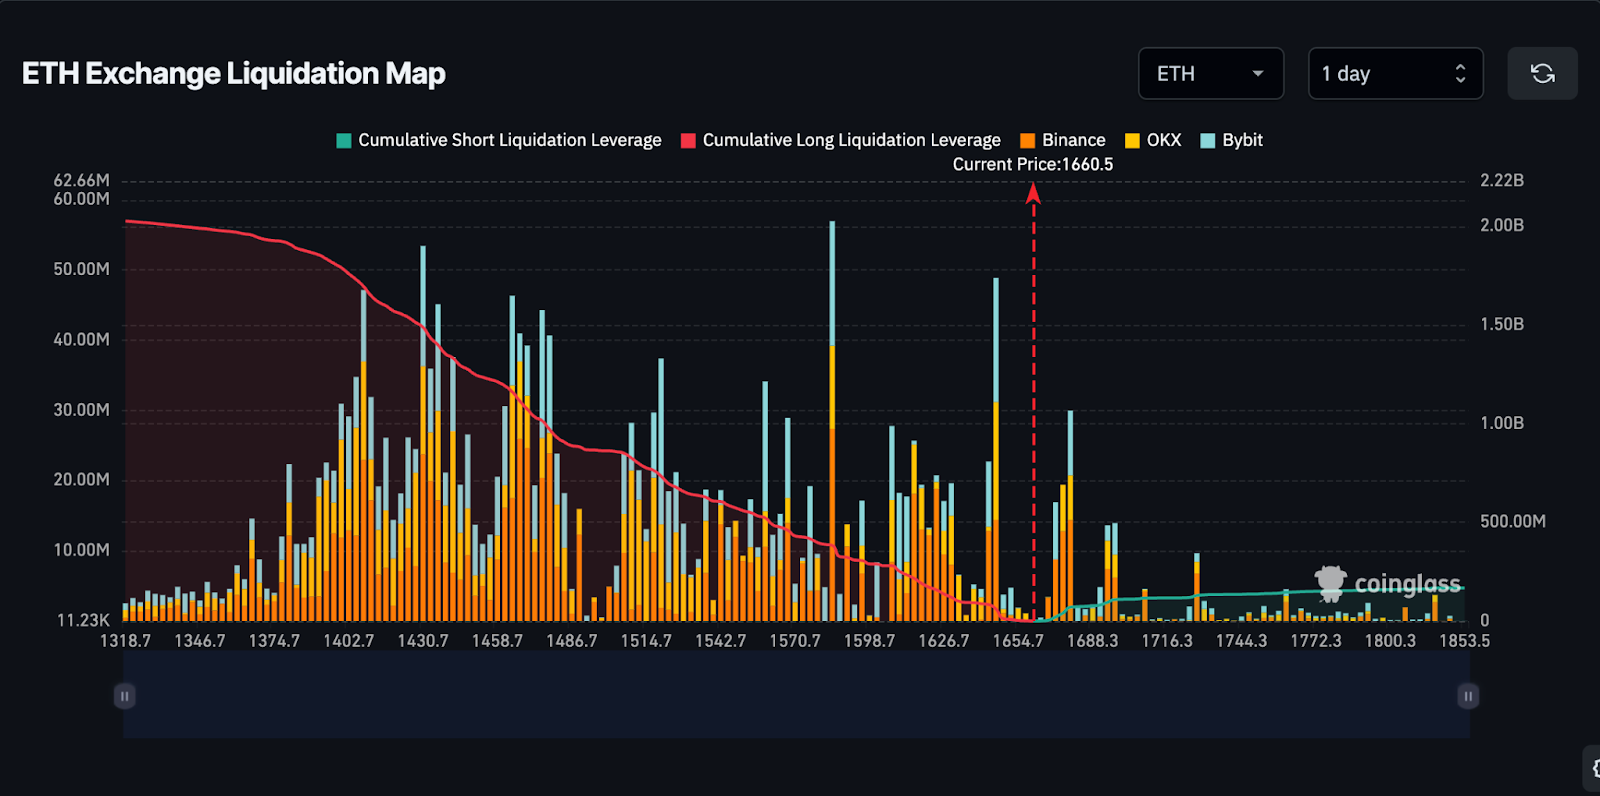
If it moves up, it might cause a chain reaction of short liquidations. These liquidations can lead to very rapid price increases as traders are forced to buy back at higher prices.
Conversely, the concentration of short positions is greatest between $1,400 and $1,500. If the ETH price holds above this zone, it may serve as short-term support. However, there are fewer long positions above the current price, so there is less selling pressure if the price goes up.
Disclaimer
In this article, the views and opinions stated by the author or any people named are for informational purposes only, and they don’t establish the investment, financial, or any other advice. Trading or investing in cryptocurrency assets comes with a risk of financial loss.




