Dacity Coin
 streamoors
 Pudgy Penguins
 Injective
 Celestia
 Sui
Sui Pearl
Pearl

Key Insights:
- An institutional whale—Abraxas Capital—deposited $240M in USDT to Binance after previously buying $399M worth of ETH
- Ethereum’s 12-hour chart shows a looming golden cross, a bullish technical signal that could open the door to $4,200.
- ETH must overcome overbought RSI and resistance at $3,042.08.
Ethereum price is down 3.3% in the last 24 hours and is trading at $2,461, after pulling back from an intra-day high of $2,574. Meanwhile, the crypto social circles are buzzing with speculation after an institutional investor that’s been buying ETH transferred a massive $240M in stablecoins to an exchange. Speculations abound as to how this potential move could impact the price of ETH. Is this the final push back to the previous all-time high?
Ethereum Price: The Whale That Everyone’s Watching
This week, the on-chain analytics crew at Lookonchain dropped a bombshell on X: an institutional whale that’s been aggressively buying Ethereum in the past borrowed $240 million USDT from Aave Protocol and deposited it into Binance.
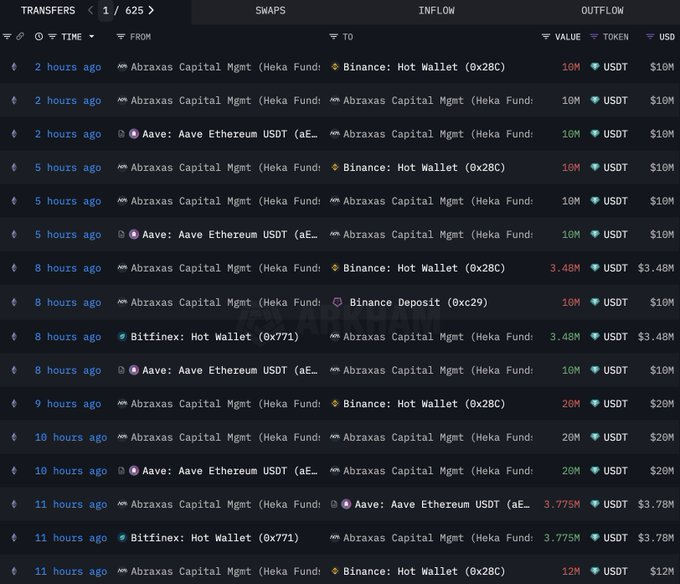
Just a day earlier, Lookonchain shared that the whale investor, Abraxas Capital, had bought and withdrawn 185,309 ETH (~$399M) from different exchanges within 3 days. This all happened as the ETH price jumped 44% from $1,800 to $2,600.
That’s the kind of flex that makes even the most seasoned degens raise an eyebrow. The buy signals serious confidence in Ethereum’s upside, especially as the market has been showing signs of life after a choppy few months. This whale’s move could be a catalyst for ETH to test its previous highs.
With ETH currently trading at $2,461, a run to $4,200 would mean a 68% pump from here. But let’s not get too hyped just yet. The market is volatile. But while this institutional whale play is a bullish signal, investors need to see if the momentum can carry Ethereum through key resistance levels.
Ethereum Price Chart Analysis: Golden Cross Incoming?
The chart for ETH/USD on the 12-hour timeframe shows ETH is currently sitting at $2,461, down 3.3% on the day, but the setup looks promising for the bulls.
The chart shows a potential golden cross, where the 50-period SMA ($1,903) is about to cross above the 200-period SMA ($2,095). For the uninitiated, a “golden cross” is a bullish signal that often comes before big price pumps. If this plays out, ETH could be gearing up for a serious rally.
ETH is testing a crucial resistance zone around $2,975.70–$3,042.08. If it breaks above this, the next stop is $3,468.34, and beyond that, we’re looking at $4,105.53—a potential new ATH. On the flip side, support sits at $2,468.34, with a deeper floor at $1,903.98 if things go south.
The relative strength index (RSI) is at 73.23, which is borderline overbought territory. This suggests ETH might be a bit overheated, so a pullback could be in the cards before the next leg up. The MACD is showing bullish momentum, but the histogram is flattening, hinting at a possible slowdown in buying pressure.
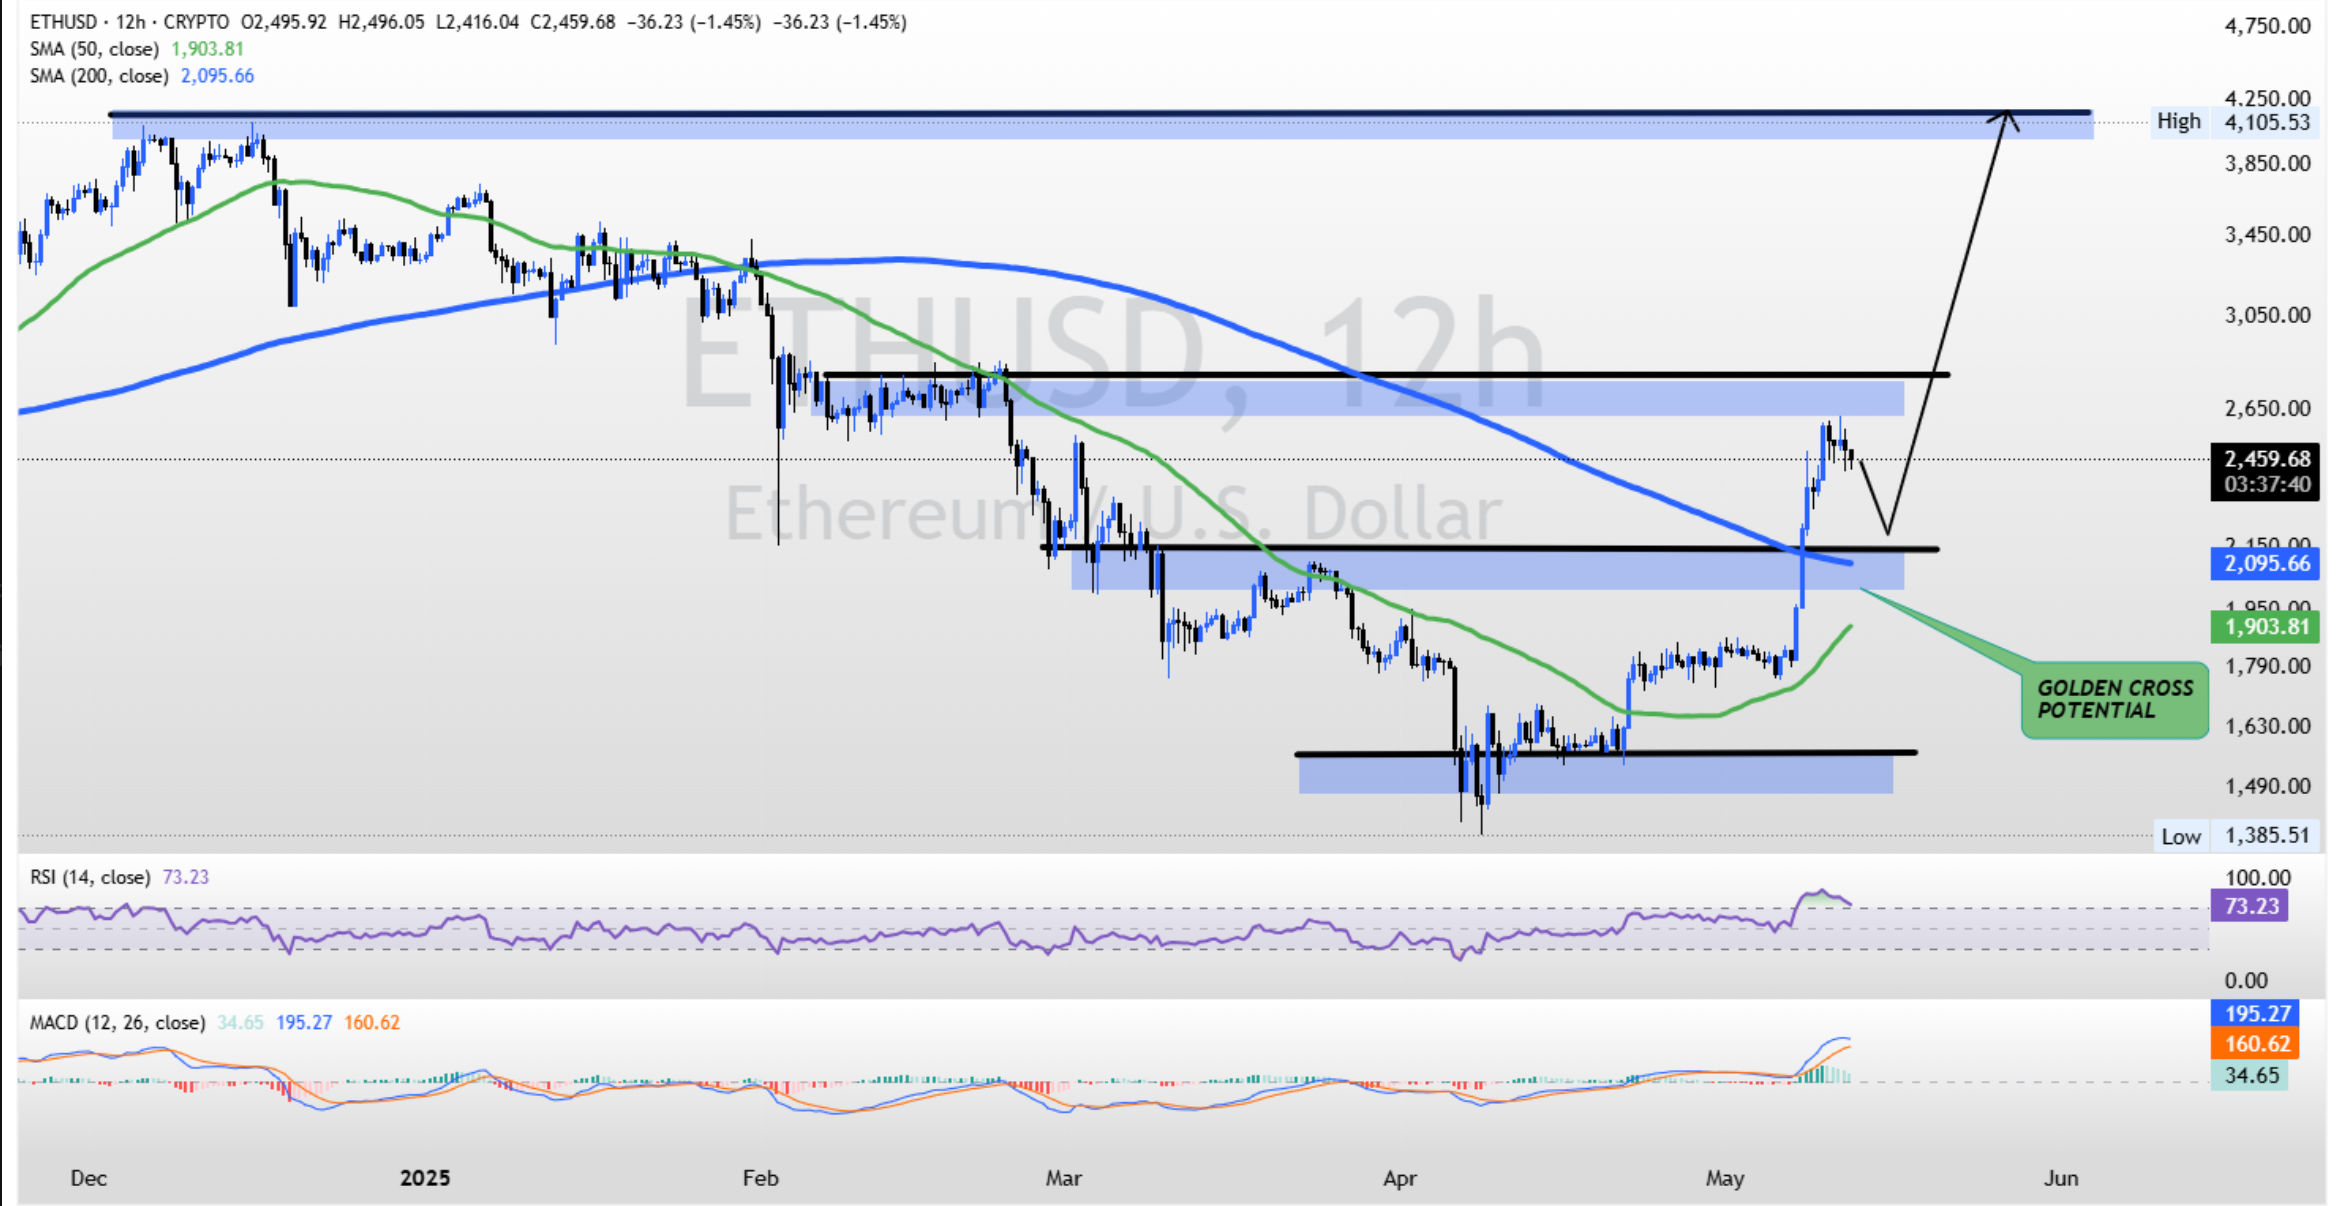
Overall, the chart screams bullish, but ETH needs to clear that $3,042.08 resistance with conviction to keep the party going. If the whale buy more FOMO, we could see ETH gunning for that $4,200 ATH sooner rather than later.
Can Ethereum Price Hit $4,200?
Will ETH reach that $4,200 ATH? The $240M whale buy is a strong vote of confidence, and the technicals on your chart back up the bullish case with that golden cross looming. However, the overbought RSI and resistance at $3,042.08 are hurdles ETH needs to clear.
If the broader market stays green and AVAX’s momentum spills over, ETH could ride the wave to $4,200 in the coming weeks. But if the bears step in and we see a rejection at resistance, we might see a dip to $2,468.34 before the next attempt.
Disclaimer
In this article, the views and opinions stated by the author or any people named are for informational purposes only, and they don’t establish the investment, financial, or any other advice. Trading or investing in cryptocurrency assets comes with a risk of financial loss.