
 Pearl
Pearl Zylo Ecosystem
 Bitway
 Derive
 Walrus
 Quantus
 Pudgy Penguins

Key Insights:
- Litecoin price broke past a bullish flag, aiming to increase to $117.50 in the short term.
- Weekly RSI flips bullish as LTC eyes $200 if it reclaims $100 resistance.
- Price support is found near $94, and indicators show a good chance of the price continuing to rise.
Litecoin (LTC) price gained momentum after breaking out of a bullish flag pattern. Analysts expect the move to push price toward $117.50 in the near term. Longer-term targets include $200, but that will require a confirmed breakout above the $100 resistance zone.
Litecoin Price Breaks the Bullish Flag
Carl Moon reported that LTC price broke out of a bullish flag on the 4-hour chart. The asset bounced off the flag’s lower trendline and is now pushing through upper resistance.
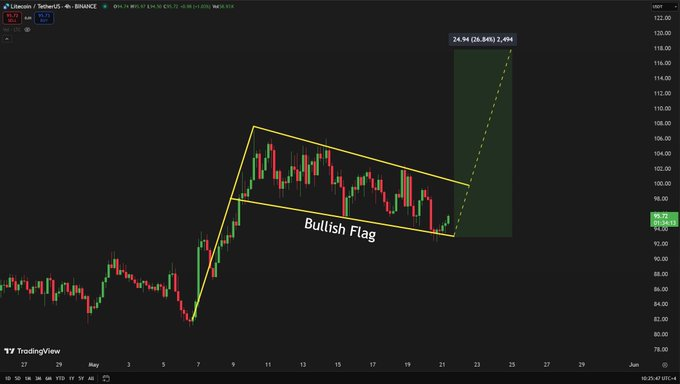
According to the flag’s measured move, the price could reach $117.50 in the next short time. The target is calculated by adding the length of the previous flagpole above the breakout level. That means there could be a 24% gain from the current price of $94.
During a breakout attempt, steady volume is necessary to prove the rally is continuing. If buying pressure increases alongside a close above $100, momentum may drive LTC price to the projected target. At present, the $100 mark continues to be the most significant barrier for bulls.
Weekly RSI Flip Suggests Larger Move To $200
Looking at a larger frame, the weekly chart hints at a possible change in Litecoin’s trend. Santolita identified a strong rebound from support and a change in the RSI above 50 as important signs. That means the rally could keep going past the early breakout in price movements.
A strong weekly base exists around the levels of $85 and $90. Based on where Litecoin is trading now, experts think it needs to rise above $100 for confirmation of its new price zone. If such an increase in volume keeps rising, it could trigger a surge up to $200.
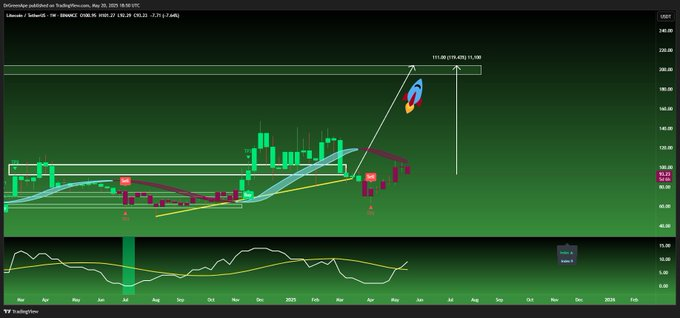
Santolita believed the top altcoin price might rise by +119% to reach $200. In most cases, it is calculated using past resistance, previous maximums from the current cycle, and the overall nature of the base formation. The momentum behind the rise is reflected by RSI values going up.
Momentum Builds as Litecoin Price Holds $94 Support
At press time, Litecoin price traded around $94, which has formed a short-term support area. This is an important level because it stopped the price rise before, and is now being tested as the point where prices break up. If buyers can maintain control here, LTC price may form a new base before its next leg higher.
The breakout from the flag and a weekly rise in price confirm the new move higher. On both short-term and 4-hour scales, strength in volume points to the market still rising.
A trend reversal may be on the way, since the MACD is turning positive on the 4-hour chart. At the same time, the Relative Strength Index is not very high, so the price can go up without facing selling pressure soon.
However, the next main support region is only found around $88–$90. If the Litecoin price drops below $94, looking for a bounce in this area will be worthwhile. As long as LTC price holds above $88, the overall bullish setup remains intact.
All eyes are on the $100 resistance zone. Traders have stayed within this technical limit in the past few months, and a successful breakout could indicate a continued rally.
If $100 is reclaimed, $117.50 becomes the immediate LTC price target. This aligns with the short-term flag breakout projection. After that, prices above $130 and $150 could form intermediate resistance, where a move up toward $200 may happen.
However, the analysis shows that if LTC price fails to break $100, it may consolidate between $88 and $98. Nonetheless, suppose the support levels fail to break, this range will still be mostly bullish.
Disclaimer
In this article, the views and opinions stated by the author or any people named are for informational purposes only, and they don’t establish the investment, financial, or any other advice. Trading or investing in cryptocurrency assets comes with a risk of financial loss.




