
 Pearl
Pearl Bitway
 Pudgy Penguins
 Optimism
 Walrus
 NEAR Protocol
 Pons
Pons

Key Insights:
- SUI price trades at $4.14 as analysts confirm an ascending wedge targeting $11.50.
- DEX volume and stablecoin inflow on SUI hit records signal rising adoption.
- SUI’s active users have tripled in 3 months, supporting the current price breakout.
SUI price is gaining strength across technical and fundamental fronts. Analysts now predict a breakout toward $11.50 as the network sees expanding adoption and higher engagement across decentralized exchanges.
SUI Price Eyes $11.50 if Momentum Holds
Analyst Bitcoinsensus observed that SUI price is forming an ascending wedge, with consistent higher highs and lows. He noted three impulsive waves since launch, each longer and stronger than the last.
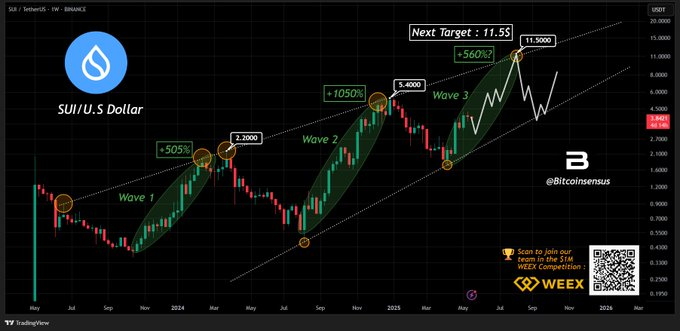
The wedge pattern suggests a continuation toward $11.50 if momentum continues. Current support rests at $3.70, where consolidation is holding firm.
Volume spikes during prior breakouts suggest another rally may follow soon. If volume increases again, analysts believe wave four could begin with strong upward pressure.
Analysts Confirm SUI Price Momentum at Local Bottoms
Analyst Mags shared a historical chart showing SUI price consistently rebounding from every major local bottom. He highlighted that every time the price pulled back, it made a new high, a sign of strong buying by investors. Analysts believe that the current trend will go on, and $11 remains the main target.
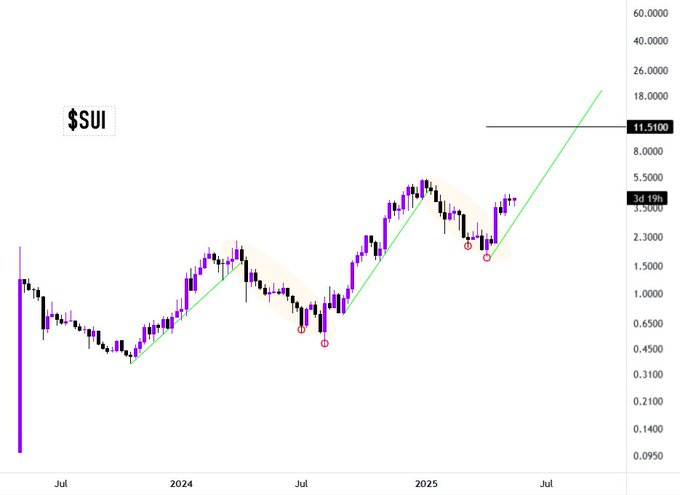
Furthermore, according to Michaël van de Poppe, SUI’s latest surge showed how strong it has become. He believed that on-chain indicators and an accurate breakout are helpful for the blockchain. Poppe explained that when breakouts occur at support and resistance levels, the resulting movements are quick and strong. He pointed out that the more a breakout occurs, the stronger the price action will be.
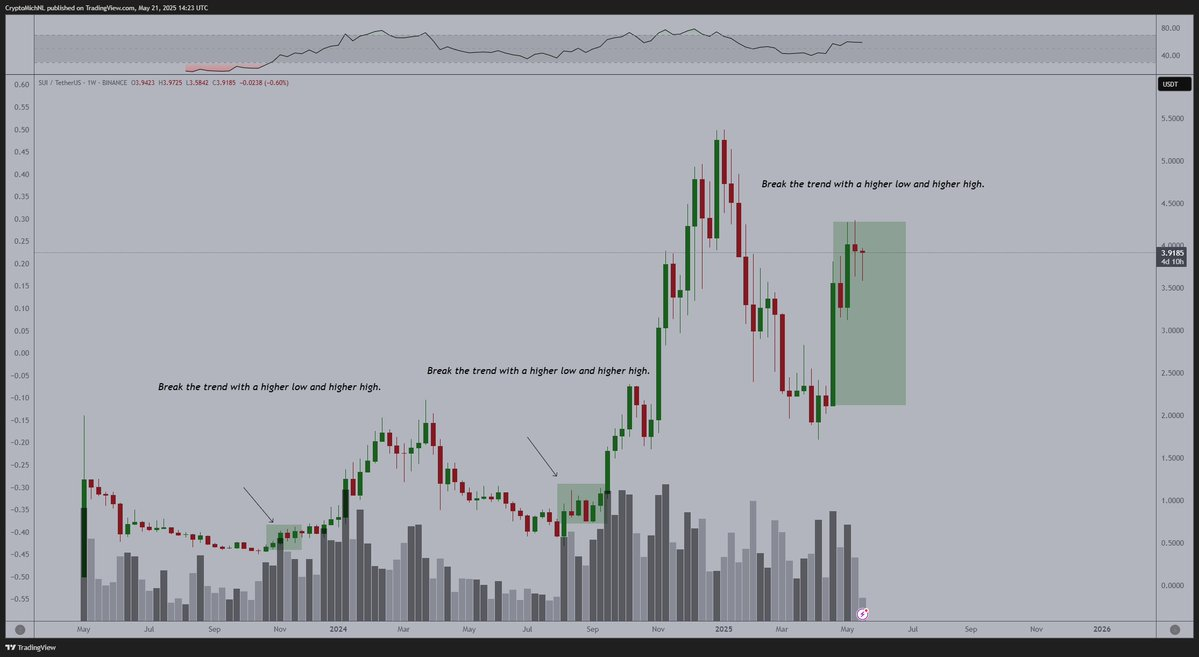
Meanwhile, his accompanying chart showed SUI price breaking above a previous resistance, forming a new higher high and validating a bullish market structure. This pattern is similar to how earlier breakouts led to strong rallies. If the price is higher than the flip zone, SUI is still in an upward trend.
Fundamentals Strengthened With ATH DEX Volume
Beyond technical indicators, SUI’s fundamentals are rapidly improving. Van de Poppe stated that the value of SUI trades on decentralized exchanges has set a new high (ATH), indicating more users and liquidity on DEXs. These activities by users on the chain build trust in SUI’s ecosystem.
The data showed most stablecoin inflow is happening on SUI. Poppe pointed out that SUI is receiving most of the stablecoin inflows, indicating that big participants are active on the network. When there is a sudden increase in liquidity, it can lead to price rises due to an increase in trading and volume.
Daily active users (DAUs) have tripled in the last three months, making this an important metric. The rise in users suggests that more people are adopting SUI, likely because of its expanding DEX and DeFi applications. The network becomes more valuable over time as engagement rises.
SUI Price Prediction: Key Levels to Watch
From a technical and on-chain point of view, SUI appears very strong. Resistance is found at $5.20 and $6.80, with $3.70 being critical support. If the price rises above $6.80, supported by strong volume, it could push it toward $11.50.
As long as SUI price maintains higher lows and growing network activity, analysts expect continuation. Once a surge in volume occurs during an upswing, it could open the door to the following impulsive period.
Meanwhile, at press time, SUI price is trading at $4.17 after a 9.50% daily surge, with 24-hour volume rallying by 67.00% to $ 2.05 billion. The market cap has risen and is now at $13.94 billion.
Disclaimer
In this article, the views and opinions stated by the author or any people named are for informational purposes only, and they don’t establish the investment, financial, or any other advice. Trading or investing in cryptocurrency assets comes with a risk of financial loss.





