Wisp
Wisp Doge Pepe
 Zylo Ecosystem
 Crawlerpad
 Pudgy Penguins
 Pearl
Pearl Basic Attention

Key Insights
- Litecoin price has broken out of a falling channel and now targets the $120 resistance.
- Analysts forecast a macro rally to $230 if LTC price holds the $96 support on the daily chart.
- A falling wedge breakout supports continuation toward $112, $128, and $140 levels.
Litecoin price has reclaimed investor attention with a confirmed breakout from its falling channel, prompting renewed bullish sentiment across the market. Currently, the price is at $94 and some analysts believe it may go higher, with $120 being the start of an even bigger upward trend. Notably, LTC price could be preparing for a broader push to $140 and possibly even $230.
Litecoin Price Clears Channel Resistance, Targets $120 Next
Rose Premium Signals identified a bullish pattern as Litecoin broke above the upper line of a clear falling channel. The chart showed LTC price piercing the diagonal resistance with momentum, validating the move with a follow-through toward the $97 zone. According to analysts, the current trend may push prices to $120.95, just like the next Fibonacci extension zone and previous collection points.
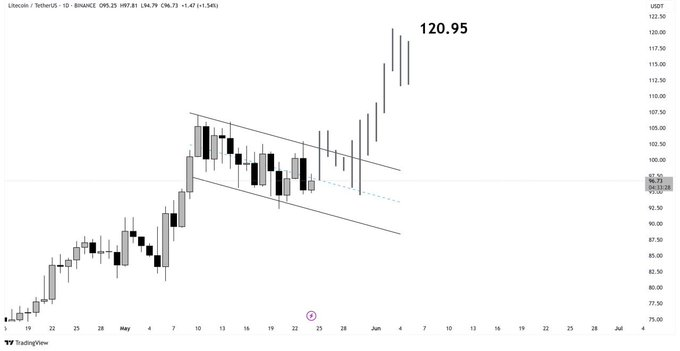
In addition, this breakout sees higher volume, which adds credibility to the movement. The daily chart shows that candlesticks form strong patterns and the upward spike proves buyers are still in control. As long as prices stay above $96, the path toward $112–$121 seems more likely in the near term.
Macro Structure Suggests $230 Rally if Retest Holds
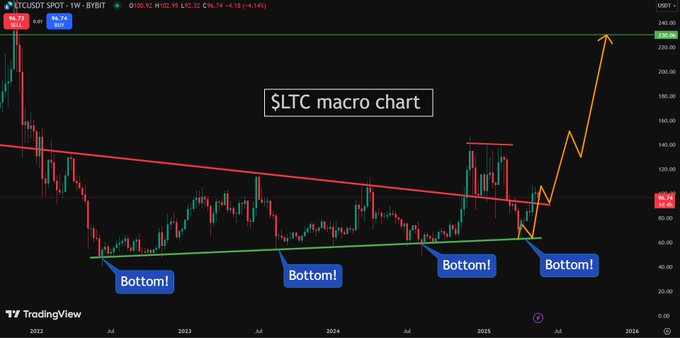
Solberg Invest noted that a long-term ‘macro’ bottom has formed in the LTC market throughout over a year. The price action on the chart is marked by regular higher low levels noted as “Bottom!” zones, together with a multi-year descending line that has been overcome. Based on this perspective, Litecoin has built a strong bottom and is now set to retest a key resistance level.
Solberg emphasized that if LTC price successfully retests the breakout zone, around $90 to $96, then a rally toward $230 is in play. This prediction relies on the fact that historical post-breakout momentum has caused big upward price shifts before.
According to the analyst, $230 is the first target in this macro rally cycle as it matches the major resistance seen in early 2022.
Litecoin Price Support at $96 Crucial as Analyst Monitor Momentum
CRYPTOWZRD stated that the current Litecoin price is close to a key level of support at $96. Analysts found that early this week, prices were unsure as there was a demand for stronger bullish candles to verify a further rally. The intraday chart showed LTC price approaching resistance at $102.
Interestingly, if Bitcoin continues to show strength and Litecoin price moves above $100 on a daily closing price, a long term opportunity may be on the horizon.
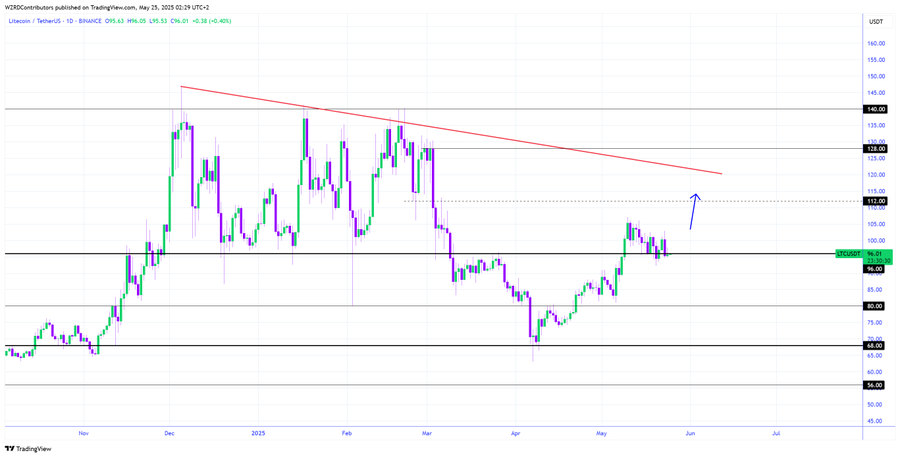
The accompanying chart supported this cautious bullish stance. Over the past two days, price has gathered beneath a downward-trending resistance line positioned near $112. A successful breakout above that area could enable Litecoin price to surge to levels around $128 and $140. However, failure to hold $96 support could end the bullish rally for the time being and return the downside to $87.
Key Levels to Watch
At press time, Litecoin price traded at $94.40, down by 2.45% in the past day. There was a total market cap of $7.16 billion, and 75.89 million Litecoin have been issued. The volume over the same period fell by 2.08%compared to the previous category.
There was selling pressure, as the price went from a high of $96.85. Even with recent positivity, LTC is meeting resistance at the $97 level. If support at $94 fails, further downside may follow.
Notably, traders will now wait for the market to form a bull flag or consolidate over $100, suggesting a continuation of the upward trend. A repeat of the breakout level would suggest that the market is strong and is heading for a new low.
Disclaimer
In this article, the views and opinions stated by the author or any people named are for informational purposes only. And they don’t establish the investment, financial, or any other advice. Trading or investing in cryptocurrency assets comes with a risk of financial loss.