
 Pearl
Pearl Puffer
 NEAR Protocol
 ZKsync
 Bitcoin
 Solana
 Starknet
Key Insights:
- XRP price has consolidated near $2 for nearly seven months, building pressure for a potential breakout move.
- XRP derivatives volume dropped 49.12% in 24 hours, signaling reduced leverage and healthier market conditions.
- Bollinger Bands on XRP’s daily chart have tightened since mid-May, indicating declining volatility and a likely sharp move.
XRP price has spent months moving within a narrow range near the $2 level, drawing renewed attention from analysts. With trading volumes shifting and technical signs tightening, speculation around a breakout is rising across the market.
XRP Price Seven Months of Sideways Action Near $2
Since falling from its January high above $3.40, XRP price has been locked in a prolonged consolidation phase. Notably, the top crypto has been trading in a tight range around the $2 level for almost seven months. Such consolidation has occurred with no directional movement, indicating a neutral market outlook on the mid-term.
According to crypto analyst MoonBitz, this trading pattern showed a typical range-bound setup. Historical data implied that these prolonged sidewise trends are usually precursors to a quick reversal. The buyers and the sellers also build positions in these stages, building the pressure in trading.
Once this pressure is released, price action tends to be more volatile and directional. While the direction of a breakout cannot be confirmed in advance, MoonBitz pointed to past momentum as a reason to monitor the current setup closely.
Bollinger Bands Narrowing on XRP’s Daily Chart
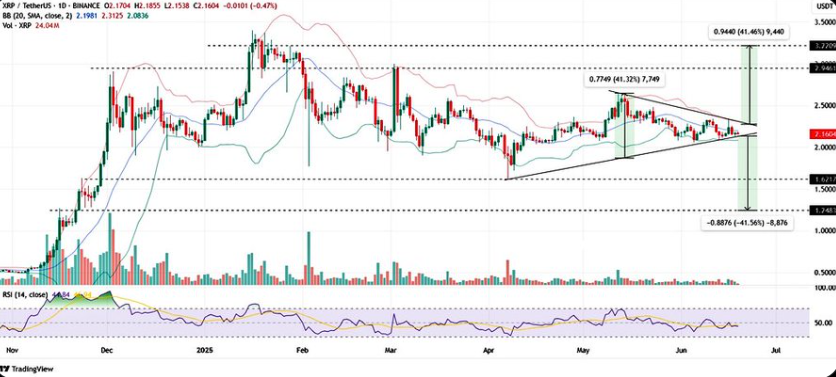
Technical indicators add weight to the breakout thesis. Since mid-May, Bollinger Bands on XRP’s daily chart have been tightening, suggesting reduced volatility. This compression followed XRP’s drop from $2.65 and has continued through the recent consolidation phase.
Bollinger Bands measure price volatility using standard deviations. When the bands narrow, it signals a low-volatility environment that often precedes strong price swings.
MoonBitz compared the current setup to late 2024, when similar band tightening preceded a rapid rally. While technical setups never guarantee future moves, the parallels have drawn increased attention from market participants.
Symmetrical Triangle and Breakout Scenarios
In addition to consolidation and tightening bands, XRP price has been forming a symmetrical triangle pattern. This formation, identified on the chart, has been in place since XRP price dropped from the $2.65 high in May.
As XRP approaches the tip of the triangle, the analyst is closely watching for a breakout. According to MoonBitz, if the asset breaks out upward, it could see gains of up to 41.46%, potentially reaching $3.20. Conversely, a downward break could result in a drop to the $1.20 zone. The current position near the triangle’s apex suggests that a breakout could occur soon.
Leverage Declines as Derivatives Activity Drops
Meanwhile, recent Coinglass data revealed that the derivatives action against XRP has dipped. Over the past 24 hours, XRP derivatives volume was reduced by 39%, equaling $ 2.52 billion. Moreover, the Open Interest also decreased by 1%, Options Volume more so by 13.55%, which indicates that there are fewer traders now holding leveraged positions.
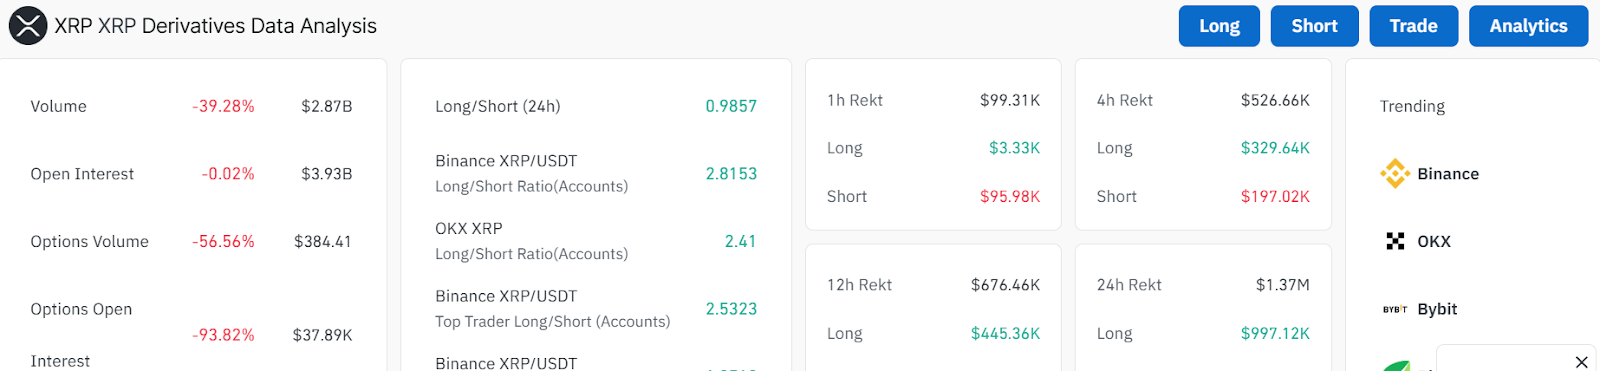
Consequently, this is a positive sign that there is some movement towards less speculative trade, which may lead to price stability. As leverage is reduced, forced liquidations are also reduced.
Additionally, this lowers the probability of XRP price fluctuations resulting when overleveraged positions being liquidated too suddenly. Consequently, the next trend (up or down) is likely to be more of an indication of the organic trading demand yielding to the unnatural volatility caused by leverage.
Further supporting an XRP price bullish breakout, recent analysis showed the token holding above weekly EMA ribbons while Bollinger Bands tightened on the 3-day chart. This combination of structural support and volatility compression suggested a potential breakout as XRP price traded between $2.02 and $2.49.
Disclaimer
This article is for informational purposes only and provides no financial, investment, or other advice. The author or any people mentioned in this article are not responsible for any financial loss that may occur from investing in or trading. Please do your research before making any financial decisions.



