
 Bitcoin
 ZKsync
 Pudgy Penguins
 Pearl
Pearl Quantus
 Starknet
 NEAR Protocol

Key Insights:
- User retention on Ethereum declined from 13% to 2.2% over 12 months.
- ETH trading volume dropped 20.97% to $15.43 billion in 24 hours.
- Ethereum price remains trapped in a $2,300–$2,750 sideways range.
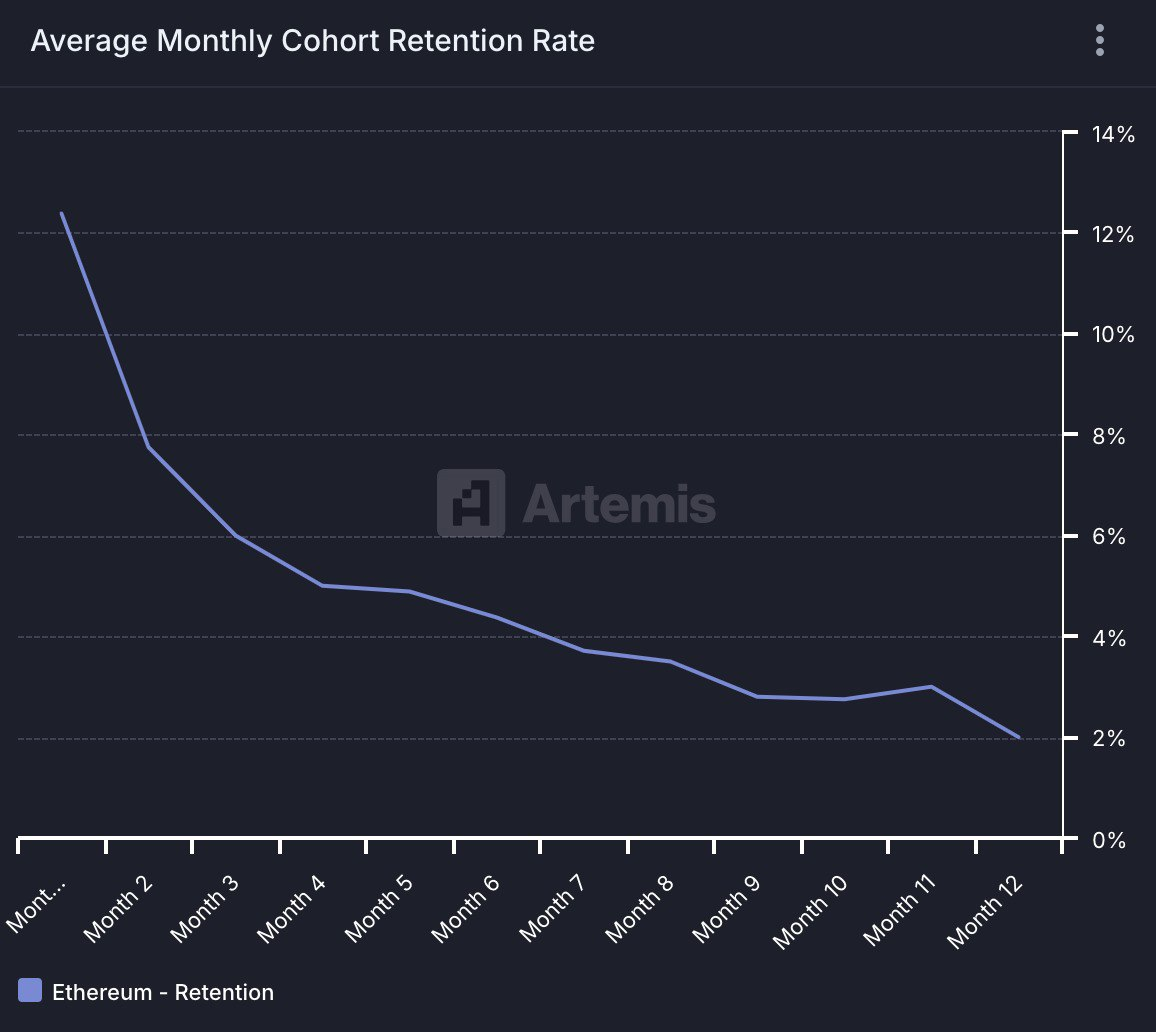
Ethereum experienced a steep, 12-month drop in its average retention rate per monthly cohort. The retention rate began at about 13% in the first month and fell steadily to only 2.2% by the twelfth month.
This downward trend represents a declining user stickiness. This is because each period resulted in fewer current users accessing applications built on the Ethereum platform.
The biggest decline was experienced between the first and second months, dipping below 6%. The trend continued at the same pace throughout the rest of the year. Retention decreased to less than 4% in month 6 and averaged 3-4% in months 7-9.
The trading volume of Ethereum registered an acute decline along with a decrease in retention. According to the data provided on CoinMarketCap, Ethereum’s 24-hour trading volume has declined by 20.97%. It has reached $15.43 Billion.
The price was $2.524 or the loss of 1.13% per day. The market cap is currently at $304.69 Billion. On the other hand, the fully diluted valuation (FDV) amounts to the same $304.74 Billion.
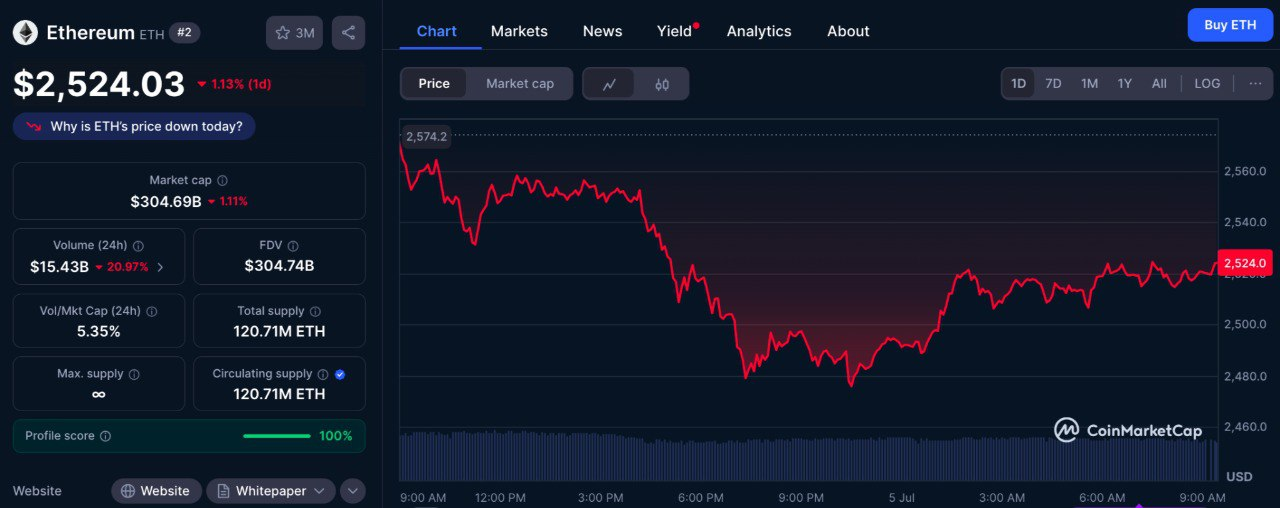
Ethereum has no fixed maximum supply, allowing continuous issuance of new ETH. The current circulating supply is 120.71 million, keeping the asset highly liquid.
Despite this, trading volume has been dropping steadily. Market pressure and declining activity suggest traders lack confidence in recent sessions.
Ethereum Moving Within a Consolidation Range
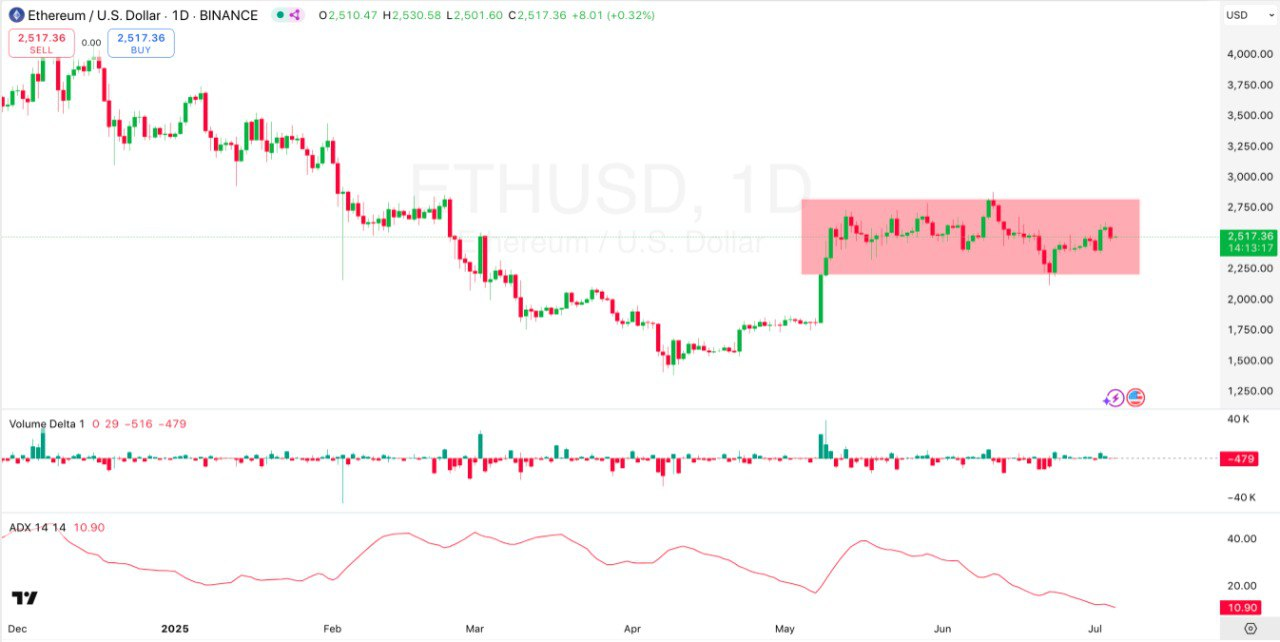
Despite institutional accumulation, Ethereum has consolidated sideways since the start of May. The token still fluctuates between support of around $2,300 and resistance of about $2,750. Since several tests, the bulls have been unable to break and sustain above the upper margin.
This extended consolidation trend in a rectangular shape portrays indecision in the market. The price candles in the range feature the absence of the predominant momentum in any direction.
The ADX reading is 10.90 daily, and the trend strength is weak. Price action can stay in a range until a breakout takes place.
The liquidation data obtained by CoinGlass also supports the stagnation of the market. The ETH liquidation chart shows both long and short positions being wiped out.
This trend was consistent through much of June and early July. Even though long liquidation has compensated slightly more than shorts in recent corrections, the volatilities are pretty even.
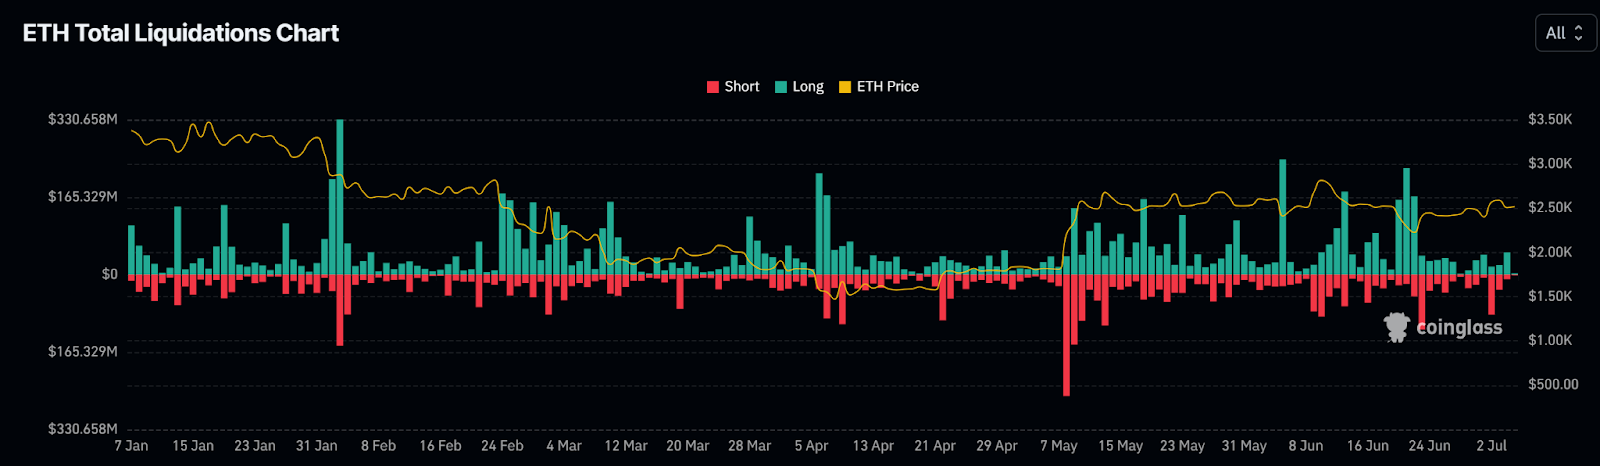
Severe intraday price declines accompanied extended liquidations in the middle of June and early in July. Thus, it strongly indicates that leveraged longs are always at risk in sell-offs.
Conversely, powerful liquidations on the short close in mid-May accompanied price developments that saw prices go lower than 2,700.
This liquidation action is two ways around highlighting the battle between the bulls and bears. No one has continuously dominated since then, leading Ethereum to have a sideways market structure.
Ethereum Price Movement Reflects Ongoing Uncertainty
The 24-hour ETH price graph backs the neutral picture. Ethereum, which has had a rough start to the month, started the day with a price of about $2,574. Ethereum price gradually dropped during the afternoon to below 2,475 but returned to 2,524 as of press time.
This price movement is similar to earlier daily trends that buyers try to recover from, but are confronted with sellers. The market has not been experiencing powerful catalysts to take direct action. They are in the mood to take intraday dips, but not with adequate conviction to maintain a bullish breakout.
Its retention rate has severely weakened between the first and twelfth months, decreasing beyond 80%. Trading levels have been reduced by almost 21 % within a day. The price movement is stuck in a sideways trend that lacks any tendencies.
Ethereum could stay in a range against major currencies unless new catalysts appear or investors’ sentiment changes. The primary resistance would be at the level of $2,750, whereas the support is close to the level of $2,300.
Disclaimer
This article is for informational purposes only and provides no financial, investment, or other advice. The author or any people mentioned in this article are not responsible for any financial loss that may occur from investing in or trading. Please do your research before making any financial decisions.




