
 NEAR Protocol
 Bitcoin
 Puffer
 Hyperliquid
 ZKsync
 Pudgy Penguins
 Pearl
Pearl
Key Insights:
- HBAR crypto has successfully broken out of a bearish descending channel price pattern.
- The daily chart indicates that HBAR has retested the breakout area and has formed a bullish Morning Star candlestick pattern. This suggests a potential upside rally.
- Data from ChainBroker reveals that HBAR ranks in the top 10 for developer activity growth over the past 30 days. That further strengthens its bullish outlook.
After months of downward momentum, HBAR garners significant attention from crypto enthusiasts. Hedera surged over 4% in the last 24 hours, ending its extended bearish phase. This breakout signals strong momentum and potential for a major rally ahead.
Bold Prediction: Will HBAR Price Hit $1?
Given the current market sentiment, both experts and analysts have shown strong interest in the asset. Additionally, they have made several bold predictions, leading many to wonder whether this is an ideal time to add it to their portfolio.
In a post on X (formerly Twitter), a well-followed crypto expert shared that HBAR could reach the $0.38 level. The expert noted that HBAR has broken out of a falling wedge on the daily chart and has gained a foothold above the support.
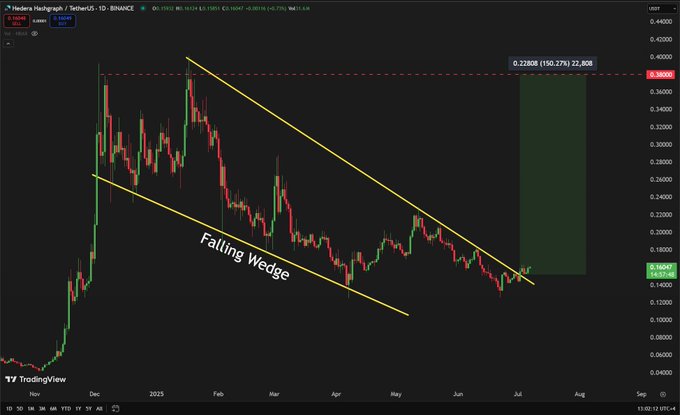
Meanwhile, another expert boldly predicted that HBAR could soar to $1 within six months. Additionally, several more predictions have surfaced on X, reflecting experts’ strong interest and confidence in the asset.
HBAR Price and Market Sentiment
Hedera showed strong upside momentum at press time, trading near $0.16. It witnessed a price surge of 3.2% in the past 24 hours. During this period, trader and investor participation have skyrocketed.
The trading volume of HBAR jumped 40% in the past 24 hours, showing a surge in investor activity. This sharp increase highlights growing market interest and momentum.
Technical Analysis: Key Levels and Chart Patterns
According to expert technical analysis, Hedera appears bullish. This is because it has broken out of a descending channel pattern on the daily time frame.
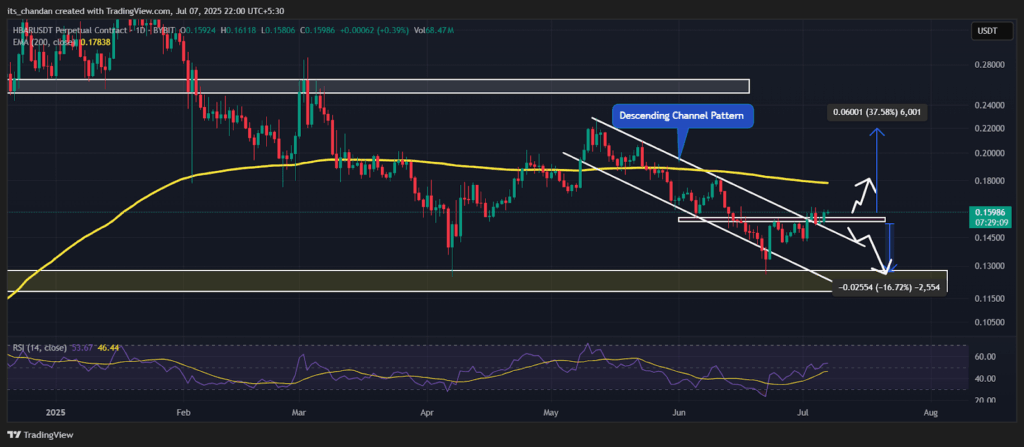
The asset has not only confirmed a successful breakout by retesting the breakout area. Still, it has also formed a bullish Morning Star candlestick pattern at the same level, suggesting that potential upside momentum is on the horizon.
Based on recent price action and historical patterns, the HBAR may maintain its upside momentum. If this happens, it could soar by over 35% in the coming days and reach the $0.22 level soon.
A decline could follow if HBAR loses support at $0.15 due to shifting sentiment. The price might drop 15%, reaching $0.127.
Technical Analysis: EMA and RSI Insights
Despite the bullish outlook, the asset trades below the 200-day EMA daily. This indicates it remains in a downtrend and could face selling pressure if the price approaches the EMA.
On the other hand, the Relative Strength Index (RSI) stands at 53. This indicates that the asset has just moved from oversold territory into neutral territory. That suggests a potential shift in momentum toward bullish conditions.
Additionally, it implies that the asset has enough room to continue its upward movement before reaching overbought territory.
Developer Activity on the Rise
Hedera’s bullish outlook is further strengthened by increased developer activity. Recently, a crypto expert shared a post on X, citing data from ChainBroker.
HBAR ranks in the Top 10 for developer activity growth over the last 30 days, up 176%. This growth puts it ahead of other networks, including NEAR, IOTA, and INJ.
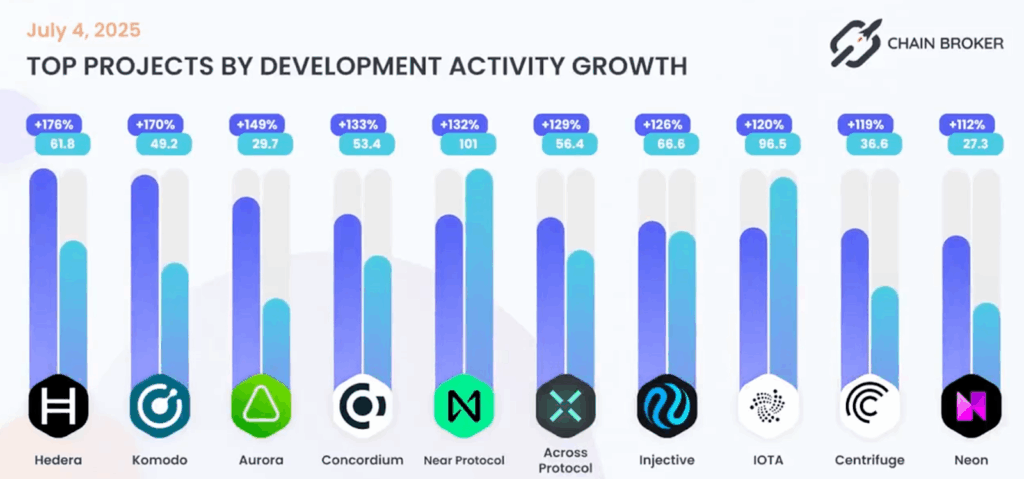
Expert predictions, technical indicators, and price movement back HBAR’s current bullish phase. Market momentum suggests bulls have taken the lead for now. Additionally, the asset shows strong upside potential.
Disclaimer
This article is for informational purposes only and provides no financial, investment, or other advice. The author or any people mentioned in this article are not responsible for any financial loss that may occur from investing in or trading. Please do your research before making any financial decisions.



