
 NEAR Protocol
 Bitcoin
 Puffer
 Hyperliquid
 ZKsync
 Pudgy Penguins
 Pearl
Pearl

Key Insights:
- Shiba Inu’s burn rate drops 29%, weakening token deflation pressure as Shiba Inu‘s price struggles.
- SHIB trades within a tightening triangle; breakout direction remains unclear.
- Volume and momentum indicators show reduced trading interest recently.
Shiba Inu price (SHIB) is slowing down amid a decline in the daily burn rate by 29.52%. Only 7.29 million tokens were burned over 24 hours as of press time. This is quite a downward trend compared to the previous days when the gains translated to increased transaction levels.
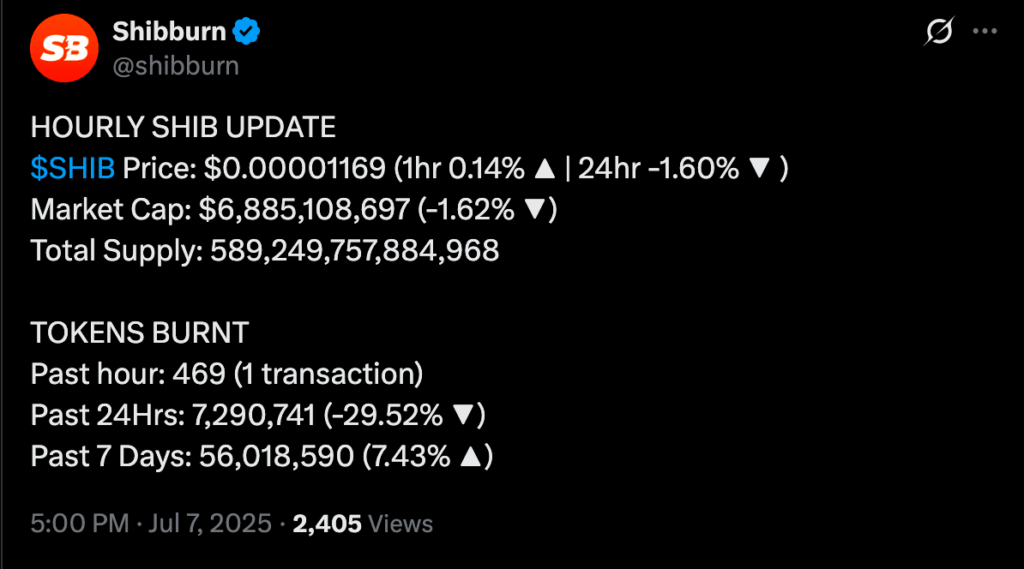
The seven-day burn indicator, however, is relatively steady with 56.01 million tokens burned. This translated to a 7.43% rise in comparison to the previous week.
Even though this is a marginal improvement week-on-week, the downfall in daily burns is steep. Network activity is slowing down, with fewer transactions taking place. This decline suggests mounting bearish pressure in the near term.
Shiba Inu price Slides Despite Brief Intraday Uptick
At the time of press, the SHIB price stood at $0.00001157. This implied a 1.74% drop over 24 hours. Trading volume saw a 10.8% drop in the past 24 hours, signaling reduced market activity.
With the current Volume at 111.12 million, this decline may reflect cooling investor interest or short-term uncertainty.
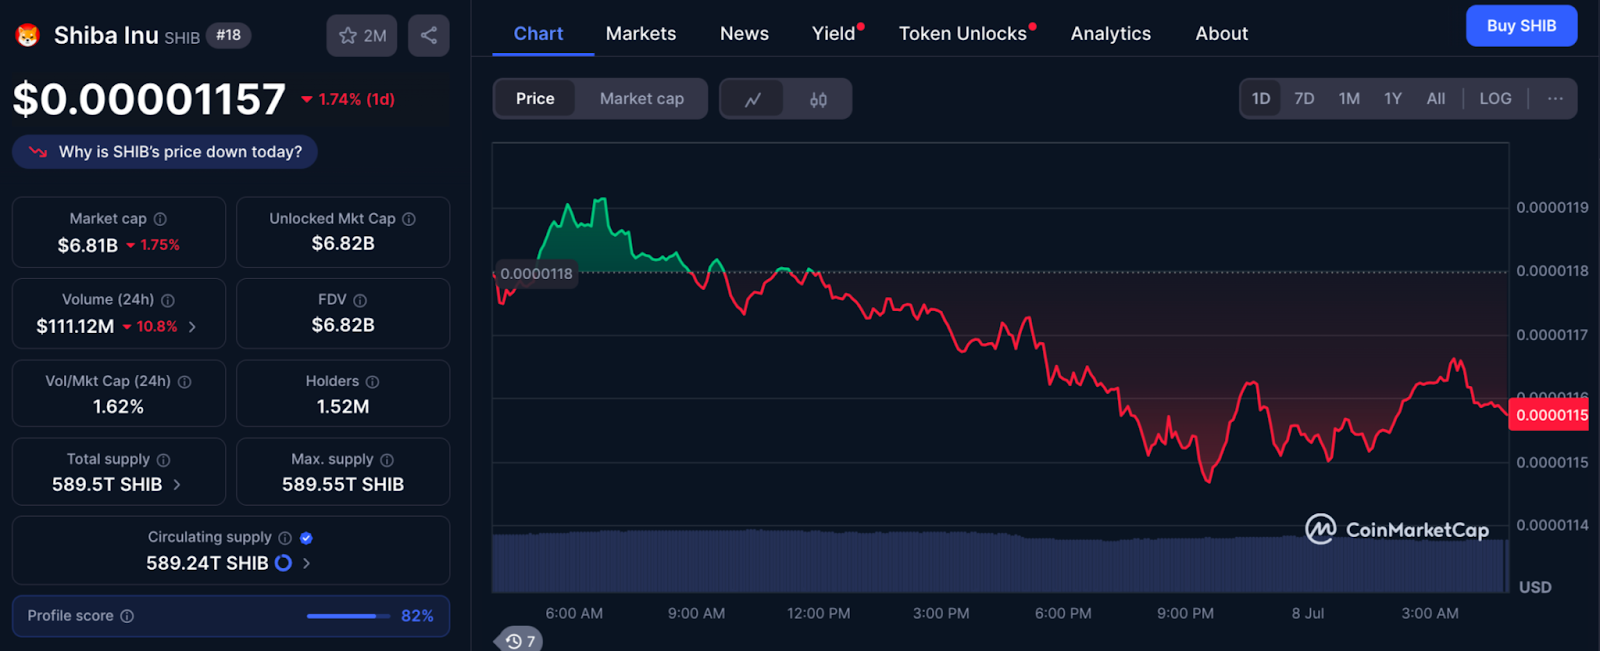
The ratio between the Volume and the Market Cap is 1.62%. This implies that the turnover is low in terms of the overall market cap of SHIB. In the meantime, SHIB has been sustaining a holder base equal to 1.52 million.
Shiba Inu price remains resilient despite lower burn activity and trading volume. The token still enjoys popularity among passive holders. This continued interest helps support its price stability in the short term.
Shiba Inu Price Analysis: Symmetrical Triangle Pattern Tightens
As of the 4-hour chart, we see a developing solidified symmetrical triangular structure. SHIB price movement is squeezed quite tightly towards the summit. The upper trendline of resistance is downward. Also, the lower support line is increasing to create a typical consolidation pattern.
Shiba Inu price has entered a trading range with a recent value of $0.00001158. It is just slightly above a major short-term support trend line. A breakout either up or down should occur because the price is about to converge at the end of the triangle.
Generally, these structures are followed by a volatility extension. Still, direction itself cannot be predicted simply from the structure alone.
The Money Flow Index (MFI) now stands at 52.61, which shows a slight positive momentum. However, it is still in the neutral territory of 50-70. This implies that even though capital inflow has not turned to bullish territory.
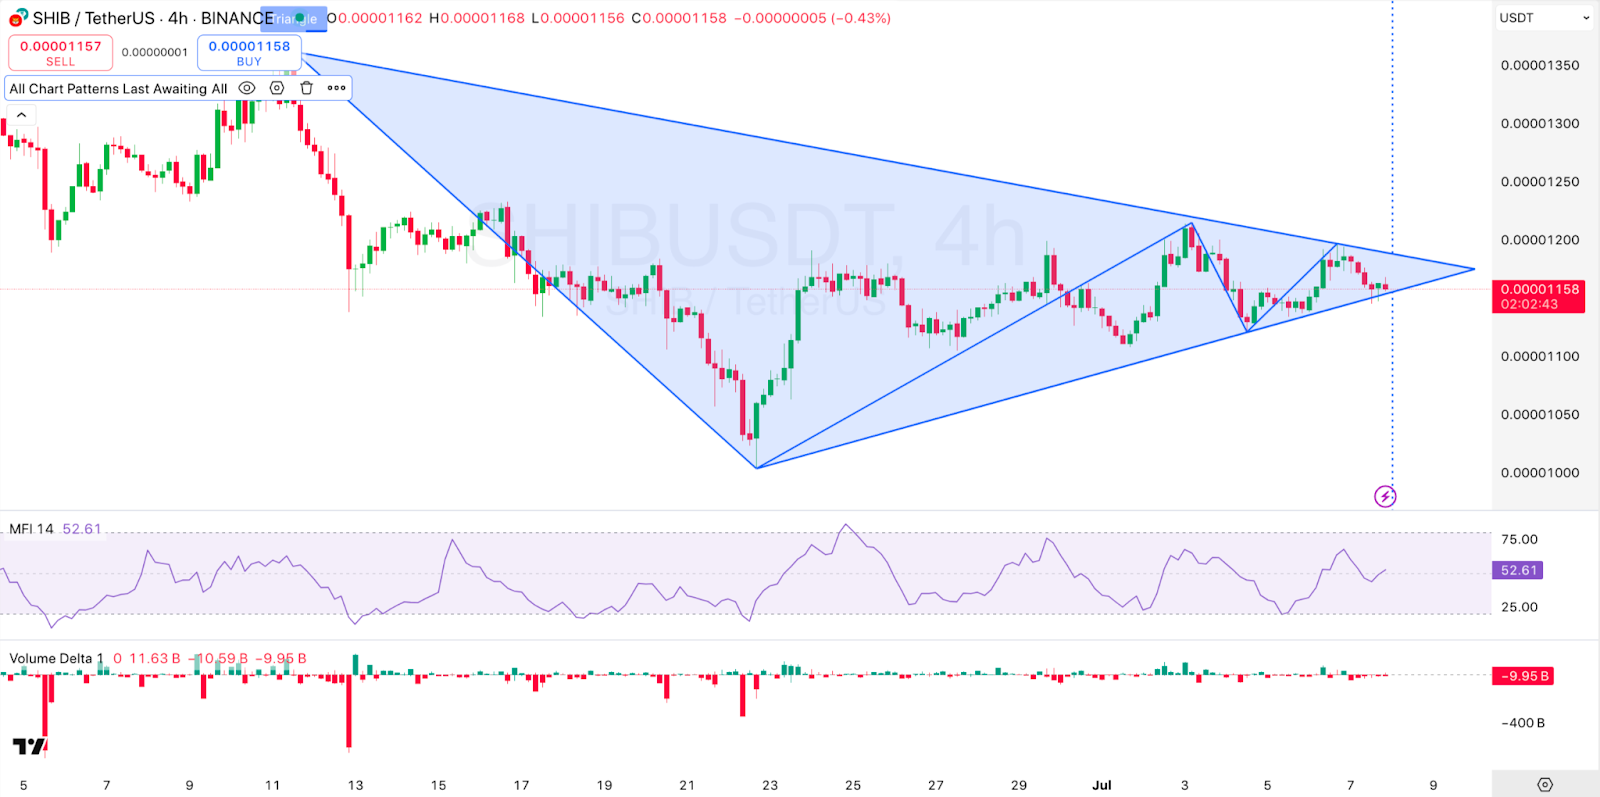
Nonetheless, it has not worsened to the distribution phase. The RSI has not reached overbought or oversold levels. This reinforces the argument that the market is in wait-and-see mode.
Volume Delta indicates that it has created a net negative number based on the last few sessions. Also, the volume divergence favors sellers.
This is consistent with the larger theme of decreasing burn rates and low trading volume. This implies that sellers still have an easy ride at this point.
What’s Next for the Shiba Inu Price?
The general volume profile backs the waning momentum. Trading volume has steadily declined over the last 48 hours. This drop is accompanied by growing bearish pressure on the SHIB price.
Bulls have been trying to recover by some means. However, they have not retained much upside movement past the resistance zone at $0.00001200. This can also be proven by the candlestick wicks seen at local highs. These wicks are a sign of rejection and diminishing demand.
Shiba Inu price is showing signs of testing support at nearly $0.00001100. If the trend continues, the cost could dip to that level. Alternatively, SHIB might bounce back toward June’s price action. This could reaffirm support around the $0.00001050 range.
A relief rally can happen when the Shiba Inu price breaches the $0.00001200 level with high Volume. In contrast, a collapse below $0.00001100 can catalyze a more significant correction.
Disclaimer
This article is for informational purposes only and provides no financial, investment, or other advice. The author or any people mentioned in this article are not responsible for any financial loss that may occur from investing in or trading. Please do your research before making any financial decisions.



