
 NEAR Protocol
 Bitcoin
 Puffer
 Hyperliquid
 ZKsync
 Pudgy Penguins
 Pearl
Pearl

Key Insights:
- SUI’s breakout signals bullish momentum toward new all-time highs.
- TVL near $2B shows growing DeFi confidence in SUI price.
- Altcoin season may fuel the Sui price surge to $5.
Sui price has maintained support above the $3 level, signaling continued strength amid a broader market uptrend. Over the past 24 hours, SUI has surged more than 10%. It got boosted by Bitcoin’s new all-time high, which has energized the entire crypto market.
The increased trading activity has pushed SUI’s 24-hour trading volume to $1.22 billion, marking a 126.47% jump.
The bullish momentum suggests SUI could revisit its all-time high (ATH) of $5.35, set on January 6, 2025. Although the current price remains nearly 40% below the ATH, market sentiment hints at a potential breakout. Analysts indicate that if this trend persists, SUI could test the $5 mark within this month.
This recent rally, combined with strong trading volume, is a clear signal that SUI might be entering a highly profitable phase for investors. The price action reflects growing confidence and anticipation of new highs in the coming weeks.
Sui Price Forecasted to Hit $5 Soon
The Sui Community has ignited interest in social networks with impressive marketing prospects of its native token, SUI. Recently, the official Sui Community account stated that the token was taking off in a recent X post and that it is time to be ready for a surge that is imminent.
The post even gave the prediction that SUI price might hit the $5 mark in July, indicating the possibility of a bullish breakout.
This positive outlook is given as the provided market interest rises towards layer-1 blockchain ecosystems. Sui, because of its high-speed transaction processing, has been under the radar of the retail and institutional investors over the past few months.
Another crypto analyst also expects the possible explosion of SUI. He projected a target of $5 after SUI’s recent breakout.
As per ZAYK Charts, the SUI token has surged higher once more above an important declining trendline. This action has created a fresh bullish feeling, which implies that another trend to a higher price may be coming up.
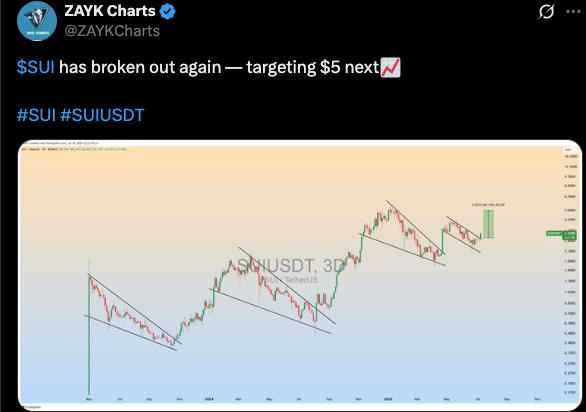
The chart posted reveals several breakout patterns that have been developed in the last few months. Every breakout of a falling wedge or a falling channel has caused an impressive price rally. The present shape is an imitation of similar breakouts of the past.
This new bullish run is in line with the technical indicators that commonly lead to major upward pressure. The chart also has a green breakout box, which predicts an upward movement towards the $5 mark.
SUI price has been standing its own ground on market consolidations, sustaining higher lows on the 3-day chart.
Sui DeFi TVL Surges Past $1.9B
According to DeFiLlama, the Sui blockchain has reached a notable milestone in decentralized finance. The platform has attained a TVL of 1.937 billion dollars, which indicates increased user activity and capital inflow.
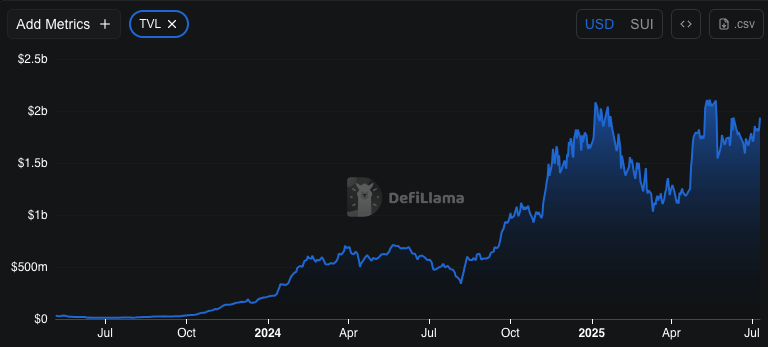
In the last 24 hours, the TVL of Sui has increased by 6.08%. The growth is an indicator of growing activity and confidence in the DeFi ecosystem of the network. The beneficial trend is the interest that investors show in the protocols constructed on Sui.
How High Can Sui Price Go?
The latest SUI price has exhibited a strong upward momentum during the last trading sessions, recording a notable gain near the $3.25 mark. This surge followed a period of sideways consolidation above the $3.00 critical support level.
The bullish sentiment is supported by the technical indicators. The MACD showed a bullish crossing, and the MACD line and the signal line would move upward. In the meantime, the histogram was printing green bars that signaled the rising momentum.
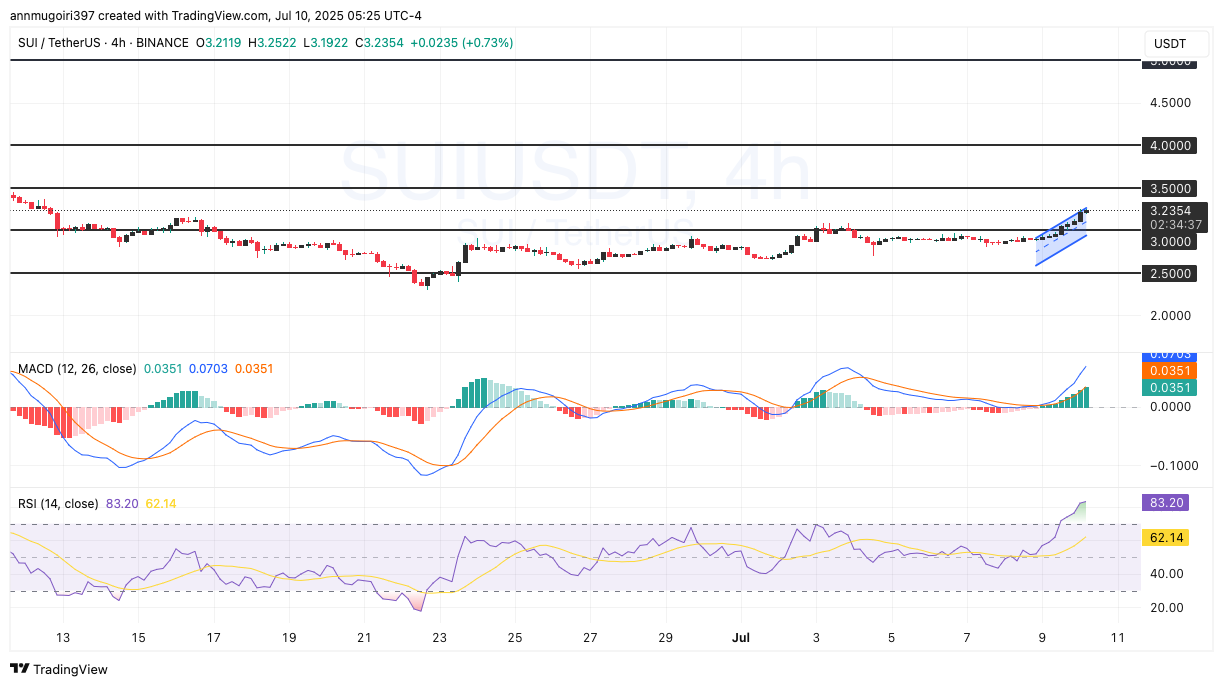
The Relative Strength Index (RSI) already spiked up to a reading of 83.49, thus undeniably in the overbought stage.
Immediate resistance for SUI price stood at $3.50, which could serve as a crucial test for the bulls. A successful breakout above that could propel the price toward the next psychological barriers at $4.00 and $4.50, respectively.
On the downside, initial support remained at $3.00, while $2.50 would act as a key level if bearish pressure intensified.
Disclaimer
This article is for informational purposes only and provides no financial, investment, or other advice. The author or any people mentioned in this article are not responsible for any financial loss that may occur from investing in or trading. Please do your research before making any financial decisions.




