
 Bitcoin
 Ondo
Ondo Pudgy Penguins
 Walrus
 Pons
Pons Quantus
 NEAR Protocol

Key Insights:
- Bitcoin retraced to $117K after hitting a $123K all-time high.
- ETF inflows and low retail FOMO suggest more upside potential remains.
- On-chain metrics show strong conviction but rising short-term holder risk.
BTC Price Cools From Peak as Market Digests $123K Surge
Bitcoin’s price dropped to $117,059 on July 15 after briefly touching an all-time high of $123,100 on Binance earlier that morning. The pullback comes after the largest seven-day candle close in Bitcoin history $119,310 marking an 8.74% gain for the week.
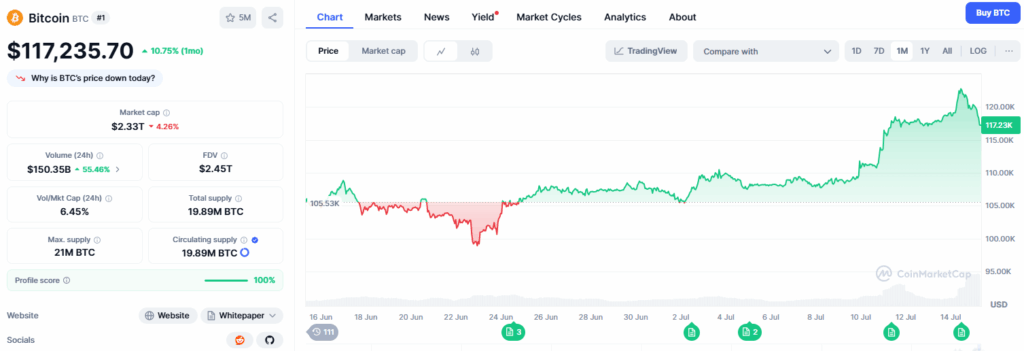
The rally, which started in early July, saw renewed bullish momentum after U.S. spot Bitcoin exchange-traded funds (ETFs) recorded their second-largest daily inflow ever. Glassnode noted that derivatives, spot, and on-chain activity now reflect a market with high conviction but also heightened risk.
This short-term pullback has not triggered panic. Historical behavior shows similar post-breakout consolidations often precede continued upside, especially during price discovery phases. Market participants are watching key structural indicators to gauge the rally’s sustainability.
ETF Inflows Highlight Structural Shift Behind Bitcoin’s Momentum
U.S.-listed spot Bitcoin ETFs posted $1.18 billion in net inflows last Thursday, the second-largest single-day figure since their launch in Jan. 2024. Ecoinometrics said this activity marks a shift in investor behavior, noting that “strong inflows regimes” typically last several sessions.
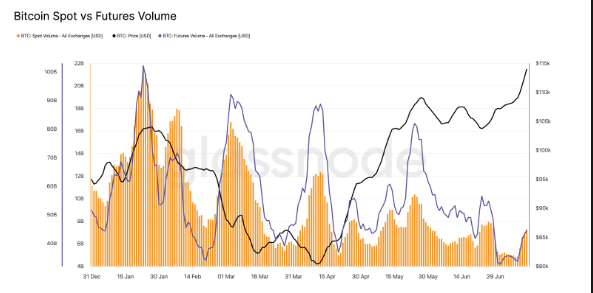
Glassnode data also revealed a 50% spike in Bitcoin spot volumes over the past week. While that points to renewed buying interest, volumes still sit 23% below the year-to-date average. The trend suggests momentum is returning, but retail euphoria remains muted.
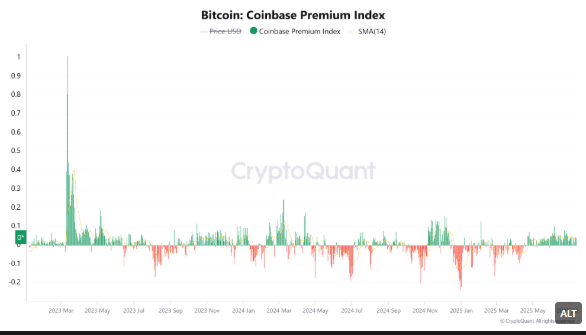
Coinbase’s Premium Index the price gap between Coinbase and Binance also supports the institutional demand thesis. The 14-day moving average of the index has remained positive for its longest stretch this cycle. U.S.-based investors continue to pay a premium for exposure, indicating steady demand despite elevated prices.
On-Chain Metrics Show Strong Conviction Without Retail Euphoria
Glassnode’s Market Pulse this week highlighted that short-term holder (STH) behavior remains within moderate bounds. The Net Asset Value (NAV) premium for STHs stands at 16%, well below the overheated 30%–35% range typically associated with cycle tops.
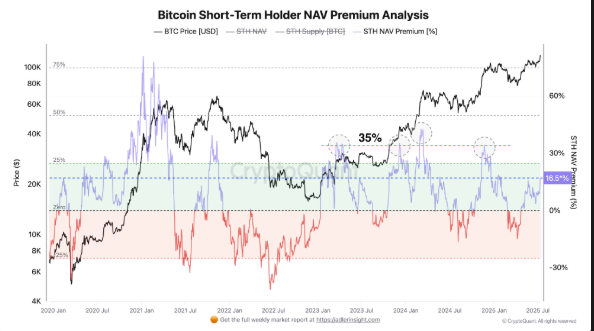
The 0%–25% NAV premium zone indicates cautious optimism. This level has historically reflected early-stage bull market behavior rather than late-stage FOMO-driven buying. Bitcoin’s on-chain transfer volume and unrealized profit/loss ratios also suggest the market is not yet in a speculative frenzy.
Price momentum remains robust, but it has not entered extreme territory. Glassnode’s indicator bands show that the latest move still tracks inside historically sustainable growth zones. This is supported by the gradual rise in options open interest, which signals confidence without excessive leverage risk.
Volatility Drops as Institutions Anchor Bitcoin’s Price Structure
Beyond price action, structural changes in Bitcoin’s volatility patterns continue to surface. The asset’s 30-day rolling volatility has declined to 35% in 2025 a stark contrast from peaks of 158% during the 2019–2022 cycle.
The drop has coincided with the growing presence of institutional investors. BlackRock’s iShares Bitcoin Trust (IBIT) and other spot ETFs have consistently seen inflows even during market corrections, a trend that began following ETF approvals in Jan. 2024.
Such buying behavior reduces erratic swings, as institutions tend to average into dips rather than react to price noise. Analysts attribute Bitcoin’s increasing stability to this longer-horizon capital. While not immune to macro shocks, Bitcoin’s response to volatility is now more aligned with traditional assets like gold and the S&P 500.
Adoption Expands as Financial Advisors Push Crypto Exposure
Institutional participation is also reshaping retail adoption pipelines. Registered investment advisors (RIAs) now offer crypto allocations through conventional portfolios. Ric Edelman, co-founder of Edelman Financial Engines, recently recommended a 10%–40% crypto allocation, depending on risk appetite.
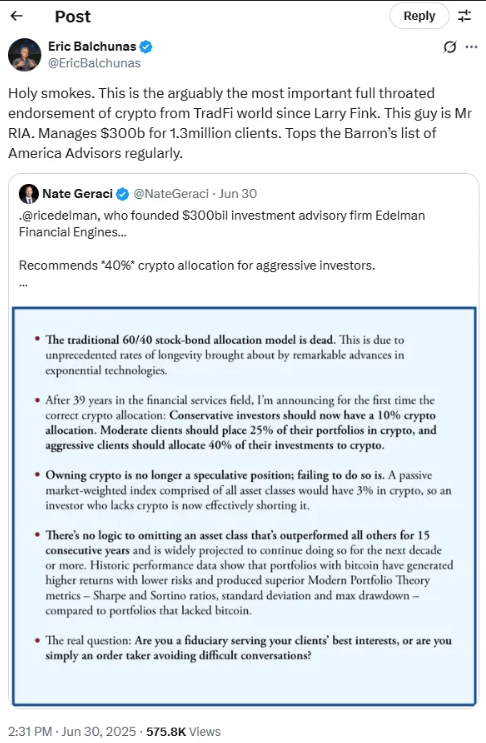
With RIAs managing over $146 trillion in assets under management (AUM), even a modest allocation shift could drive exponential Bitcoin demand. A 1% shift alone would represent over $1.4 trillion — more than 40% of Bitcoin’s current market cap.
Pension funds have also started participating. Funds in Wisconsin and Indiana disclosed spot ETF investments, underscoring Bitcoin’s growing integration into traditional finance. Analysts caution, however, that with mainstream adoption comes added custodial risk and regulatory scrutiny.
Cooling or Loading for Next Leg Up?
Bitcoin’s retreat to $117K may seem abrupt, but data does not yet point to exhaustion. With retail participation still subdued, strong ETF inflows, and on-chain indicators in healthy ranges, analysts argue that the rally has room to continue.
However, short-term volatility remains a risk. If NAV premiums or options open interest spike aggressively, concerns over overheating could return. Until then, Bitcoin appears to be digesting gains before attempting a move toward the next projected range: $132K–$138K.
Disclaimer
This article is for informational purposes only and provides no financial, investment, or other advice. The author or any people mentioned in this article are not responsible for any financial loss that may occur from investing in or trading. Please do your research before making any financial decisions.


