
 Puffer
 ZKsync
 Bitcoin
 NEAR Protocol
 Pearl
Pearl Quantus
 Sui
Sui

Key Insights:
- PEPE coin price broke out of a weekly triangle pattern, mirroring a 256% rally seen in late 2023.
- Price targets of $0.00001364 and $0.00001646 are marked as key resistance levels on the daily chart.
- Analyst highlights a sell wall near $0.00001250, with strong upside potential if bulls break through.
PEPE Coin price came into focus following a breakout of a long-term consolidation pattern. A recent weekly pattern was a replica of an arrangement in late 2023 before a 256% rally. Analysts monitored volume, resistance levels, and historical fractals to determine the possible direction of the coin.
PEPE Coin Price Weekly Breakout Resembles 2023 Pattern
PEPE Coin price weekly chart showed a building symmetrical triangle with the formation time spanning some months and then the breakout. This trend was similar to one that was established during August-October of 2023.
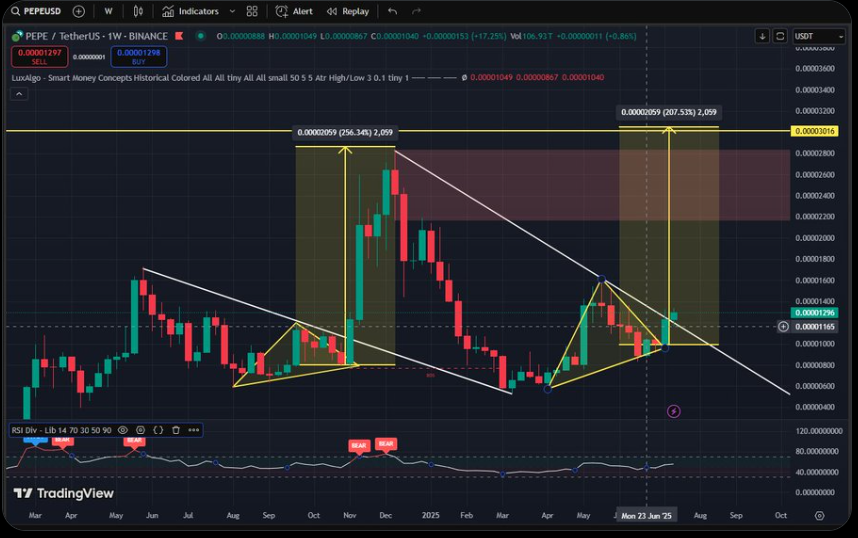
At that time, PEPE rallied over 250% following a breach of a similar downward resistance. In the current formation, the breakout followed an extended accumulation and decreasing volatility in the triangle range.
In addition, the 2023 pattern was complemented with growing weekly volume and higher and constant lows, represented in the current chart. This context has led to projections that PEPE may be entering a similar expansion phase.
Consequently, the weekly structure showed the token trading above the triangle apex, a potential continuation trigger. If momentum remains strong, a reattempt at prior highs around $0.00003016 may be likely.
Short-Term Resistance Zones at $0.00001364 and $0.00001646
On the daily chart, PEPE Coin price has two major resistance targets that can define the short-term direction. The first is around $0.00001364, where the price was rejected in a previous rally in late May. This level was both support and resistance in the past, and the price is now within striking distance.
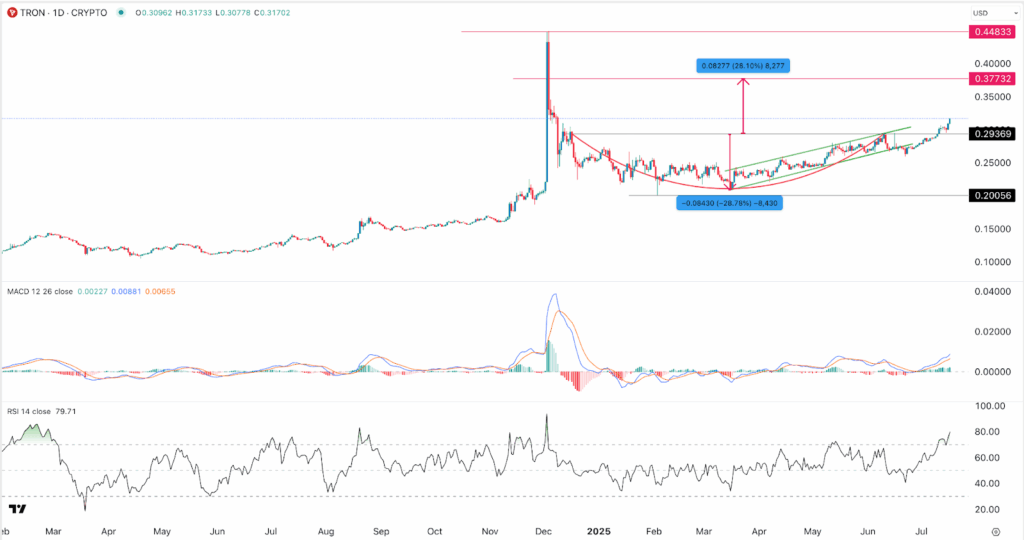
On the other hand, the second area at $0.00001646 was calculated using the peak that was created in early-June. This price corresponded to a previous liquidity hole which can influence sell orders. Should the present trend continue and break both levels, PEPE may be hit a new all-time high..
Sell Wall Observed Near $0.00001250
More so, analyst CW8900 observed a clustering of sell orders around the price area at the $0.00001250 price region. This region was a local ceiling in the previous week, with price testing and stalling at this point temporarily. On-chain order book volume profile showed a dense band of resting supply, which needed to be broken for a rally to happen.
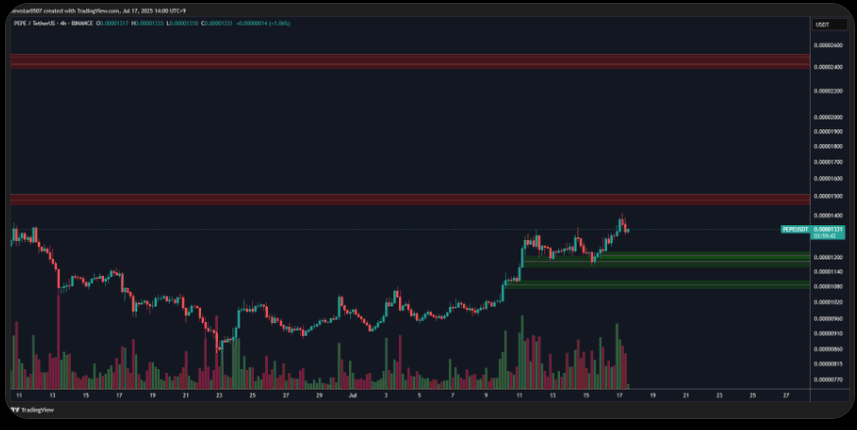
Furthermore, PEPE Coin price has now tested this resistance a number of times, and with increasingly strong trading volume each time. The frequent retesting of this level and pullback reduction indicate that buyers were still active.
Consequently, if a clean breakout above 0.00001250 is observed, the price can move faster to the further resistance levels with no notable resistance.
MACD Crossover and BBP Rise Signal Bullish Momentum
On the technical indicators, the 1-day Moving Average Convergence Divergence (MACD) present on the PEPE Coin price indicated a recent crossover. The MACD line crossed over the signal line.
Notably, such movement signals an increased upward momentum. Additionally, the histogram turned positive, indicating early strength in buying pressure.
Moreover, the Bull Bear Power (BBP) of PEPE on the 1-day chart showed a positive value. This indicated that the price action was dominated by the bulls.
The heightened surge in BBP bars matched that of a rising price. This built bullish strength as the asset tried to resume an upward trend beyond the $0.00001350 level.
At the time of writing, PEPE coin price traded at $0.00001328, up 20 % over the past 7 days. The price has consistently formed higher lows, confirming a short-term uptrend. With a 24 hour volume rising 13% to $2.22B, momentum remained bullish as the token tested resistance near $0.00001350.
Disclaimer
This article is for informational purposes only and provides no financial, investment, or other advice. The author or any people mentioned in this article are not responsible for any financial loss that may occur from investing in or trading. Please do your research before making any financial decisions.




