Pearl
Pearl Zylo Ecosystem
 Bitway
 Derive
 Walrus
 Quantus
 Pudgy Penguins

Ethereum price surged past $4,200 on Aug. 9, its highest level since Dec. 2021, after a sharp wave of short liquidations swept through the market. CoinGlass data showed that $110 million in ETH shorts were liquidated within one hour, triggering rapid upward momentum. The move pushed Ethereum into new cycle highs, with traders eyeing a possible retest of all-time highs near $4,870.
That rally came as Bitcoin dominance fell to multi-week lows, improving capital flows into major altcoins. The breakout followed weeks of consolidation near the $3,200 to $3,400 range, where demand steadily built. Spot volumes on Coinbase and Binance spiked during the session, adding confirmation to the move.
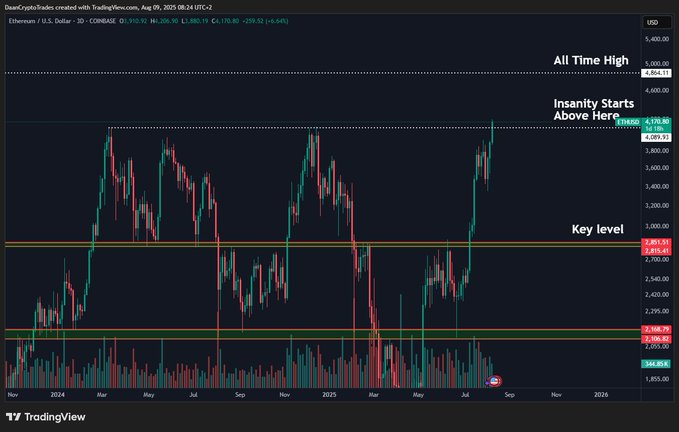
Daan Crypto Trades posted on X that Ethereum attempted a breakout and traded at “the highest level since December 2021.” He added that daily and weekly closes above the current range could set the market for a push toward record levels.
Ethereum Price Multi-Year Range Break Fuels Optimism
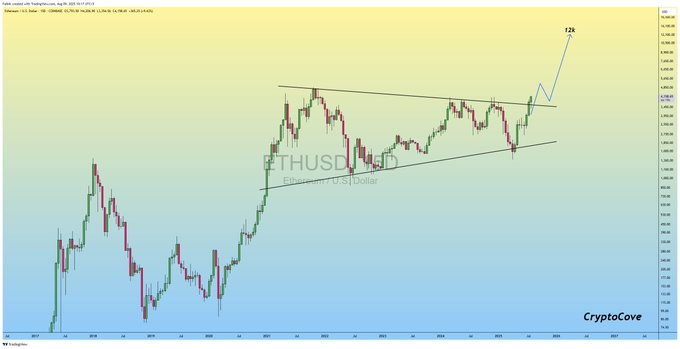
Ethereum price spent nearly three years inside a broad consolidation range before breaking out this week. TradingView charts showed a clean move above the $3,900 to $4,000 resistance zone, which had capped multiple rally attempts since early 2022.
Captain Faibik, another trader on X, said the “multi-year consolidation phase looks done” and called the move the “beginning of the mega bull run for Ethereum.” His chart indicated an absence of major resistance until the all-time high region.
The breakout coincided with a slide in Bitcoin’s dominance metric, which tracks its share of total crypto market capitalization. Historical data suggested that sharp ETH rallies during declining dominance often extended to other large-cap altcoins.
Ethereum Liquidations Added to Upward Pressure
CoinGlass order book data showed that cascading short liquidations began when Ethereum price crossed $4,050. As positions unwound, buy-side pressure accelerated, forcing additional covering from leveraged traders.
CryptoGoos noted on X that $110 million worth of ETH shorts were liquidated in the past 60 minutes during the breakout. That liquidation cluster was one of the largest for Ethereum in 2025, surpassing a $95 million spike recorded in March.
Funding rates across major derivatives exchanges also flipped positive after the surge, indicating that traders were paying a premium to maintain long positions. That shift suggested growing speculative appetite in the short term.
Macro and Market Drivers Behind the Move
The rally unfolded as U.S. Treasury yields pulled back from recent highs, easing pressure on risk assets. The two-year note yield dropped below 4.70 percent, its lowest since early July. Lower yields often encourage flows into higher-volatility sectors such as cryptocurrencies.
Broader equity markets also traded higher, with the Nasdaq Composite posting a 1.8 percent gain on the day. That risk-on sentiment helped sustain the bid in Ethereum and other altcoins.
Open interest in ETH’s futures rose alongside the breakout, climbing to $14.8 billion, according to Coinalyze. The build suggested that new positions entered the market rather than simply unwinding old shorts.
Ethereum Key Levels to Watch
Chart data placed immediate resistance near $4,300, a level that capped an intraday move earlier this week. Above that, traders pointed to $4,500 as the next upside target before testing the $4,870 record.
On the downside, support sat near $3,900, aligning with the breakout point and prior range top. A sustained drop below that level could signal a failed breakout and invite selling pressure back into the market.
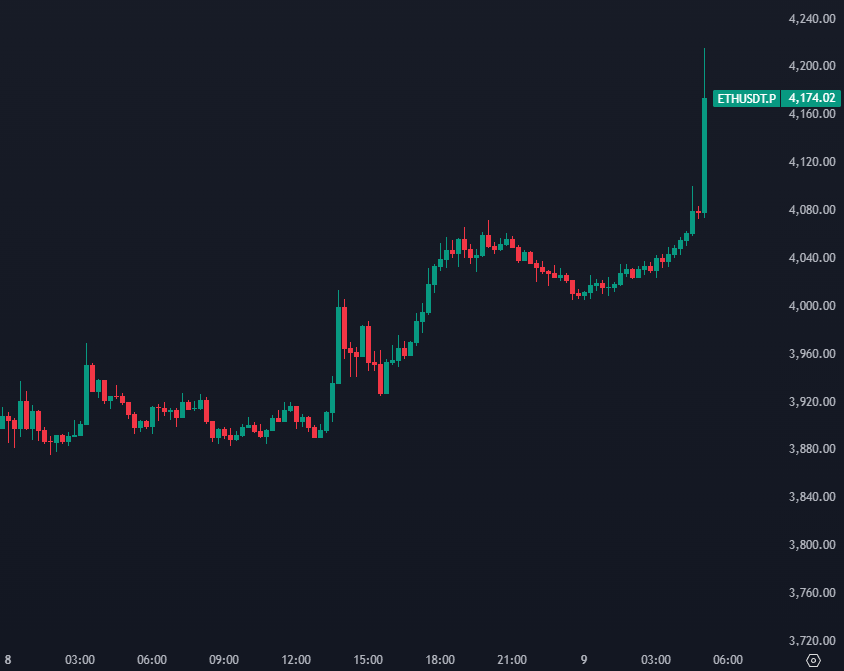
Satoshi Stacker highlighted on X that Ethereum passing $4,200 for the first time since Dec. 2021 marked “a major psychological shift” for market participants. He suggested that holding above the zone for several daily closes would be key for momentum.
Altcoin Market Reaction
The move in Ethereum price lifted sentiment across the altcoin market. Large-cap tokens such as Solana, Cardano, and Avalanche posted intraday gains between 6 percent and 9 percent. Trading volume across the top 20 altcoins rose by more than 25 percent compared with the previous day.
Bitcoin traded sideways near $113,800 during Ethereum’s breakout, underscoring the rotation of capital into alternative assets. Analysts noted that sustained weakness in Bitcoin dominance could prolong this trend.
Daan Crypto Trades said that a continued drop in Bitcoin’s market share “should also strengthen other alts,” pointing to similar setups in prior cycles.
Conclusion
Ethereum price broke through a multi-year ceiling at $4,200, driven by a $110 million short squeeze and declining Bitcoin dominance. Technical setups favored further upside toward $4,500 and $4,870 if the breakout held through the weekly close.
Traders pointed to macro tailwinds from easing U.S. yields and broad equity market gains as additional support. However, leverage metrics showed a sharp rise in speculative positioning, raising the risk of volatility in either direction.
Market focus now turned to whether Ethereum could sustain daily closes above $4,200. Failing to hold the breakout zone could send the token back toward the $3,900 support. Upcoming U.S. inflation data and Federal Reserve commentary may influence near-term price action. As Captain Faibik said, “this is just the beginning,” if momentum persists into the next leg higher.