
 Pearl
Pearl Bitway
 Monad
Monad Ondo
Ondo Derive
 Walrus
 Zcash
Zcash

Key Insights:
- Binance Coin price chart replicates the price pattern of Bitcoin gain, indicating a possible target of $1,200.
- Long positions have a bullish sentiment of 55.03% indicated by futures data.
- The next important resistance level is observed at $840.
BNB price is gaining strong upside momentum. Analysts are comparing its structure to Bitcoin’s historic breakout phases.
The general outlook on the market has become favorable. With this, the assistance of long positions on derivatives markets is increased.
Strong resistance and support levels shape the current trend. The outlook suggests a potential rise of Binance Coin toward the $1200 mark.
BNB Price Following Bitcoin’s Historical Rally Path
Analyst Ali noted similarities between the BNB weekly chart and Bitcoin’s past breakout pattern. Ali placed the charts side by side to compare price movements. He showed that ****the BNB price is where Bitcoin surged from $80,000 to over $120,000.
That stage in Bitcoin history was marked by intense buying pressure and decisive breakouts. According to Ali, the Binance coin price could be preparing for a similar move.
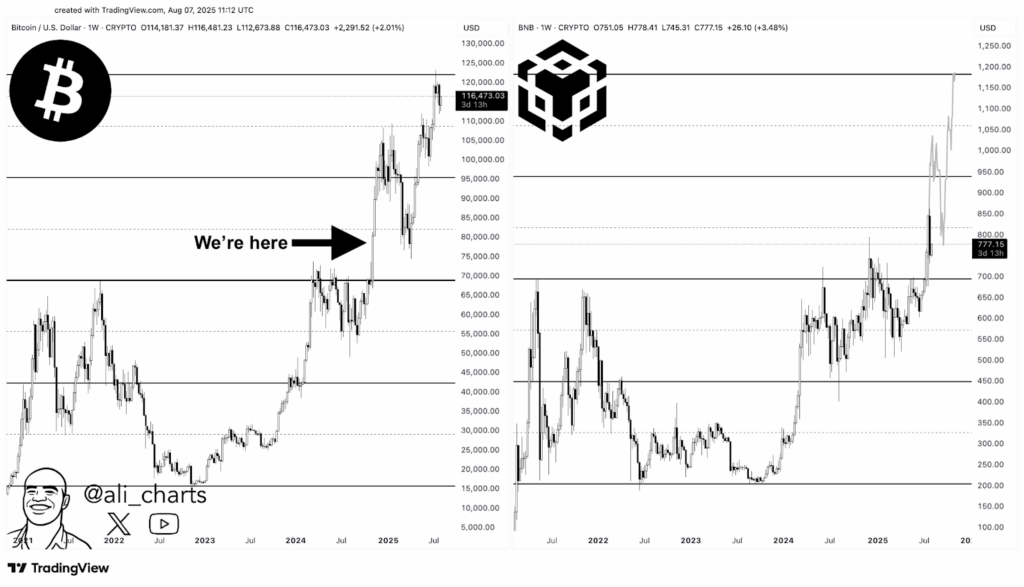
The recent BNB price surge above $700 matched Bitcoin’s acceleration point in its earlier cycle. This breakout has been followed by a sustained gain, signifying robust demand. Binance Coin could follow the same upward trajectory if broader market conditions remain supportive.
$840 identified as the Next Major Sell Wall
Meanwhile, analyst CW identified $840 as the next major resistance for Binance Coin. The 1-hour chart revealed the price moving up to this area.
It followed an increase in early-August lows around the $700 BNB price area. The heavy sell orders at the $840 area may resist the run if the buyers cannot breach further.
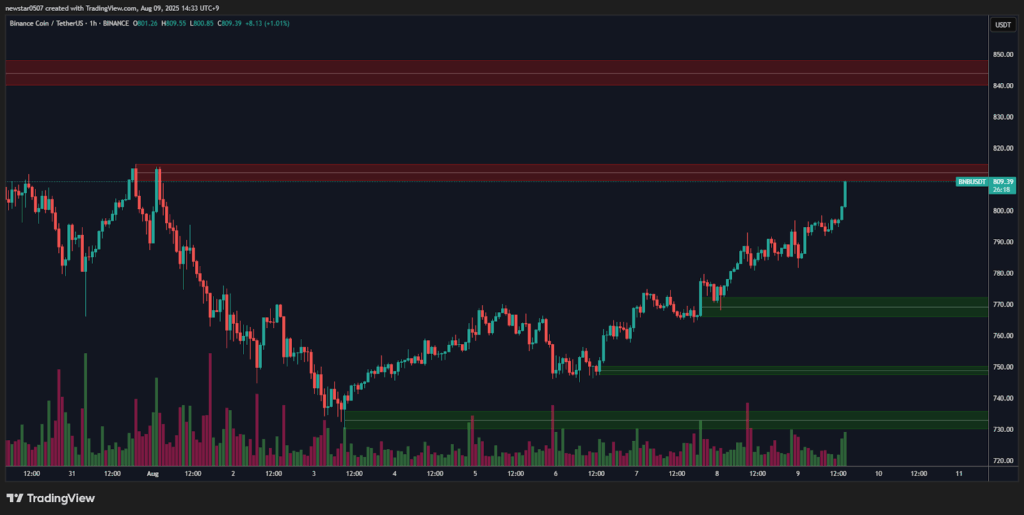
However, any break above $840 may pave the path to the $950-$1000 area. These resistances align with previous resistances and serve as stepping stones to greater prices.
Monthly Supply Zone Retest Strengthens Bullish Case
Moreover, the analyst of Trading Hub noted that the Binance Coin price has retested a broken monthly supply zone. This level has been highly resistant but has now become supportive. The retesting after a retracement is a healthy contraction of strength preceding an upside BNB price surge.
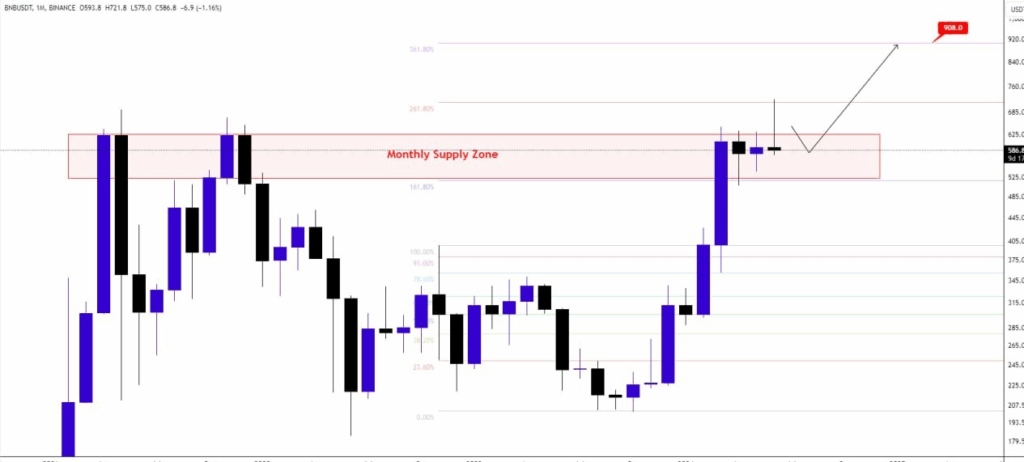
Trading Hub’s weekly chart indicated the possibility of a short-term sideways trend followed by a bullish breakout to $908.
The Monthly Supply Zone is not likely to fail soon, as it has recently reversed its position. Such support behavior often precedes renewed upward momentum.
Rising Long Positions Support Bullish Outlook
Meanwhile, Coinglass data also supported the bullish view. Binance BTCUSDT perpetual futures have exhibited a drift in the form of a long position.
As of August 9, the balance of accounts in longs was 55.03% and 44.97% in shorts. That presented a long/short ratio o.24, indicating a bullish tilt.
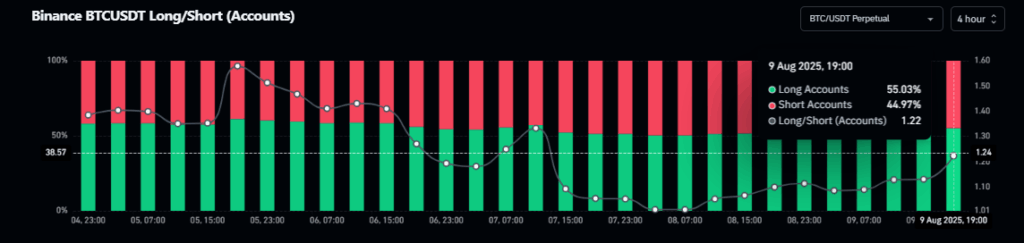
This positioning is relevant for BNB because Bitcoin sentiment often affects major altcoins. Other top coins may rise when traders are excessively bullish about BTC.
The correlation between Bitcoin’s momentum and BNB price performance has been seen in past cycles. The bullish trend can make a follow-through after clearing resistance levels.
Disclaimer
This article is for informational purposes only and provides no financial, investment, or other advice. The author or any people mentioned in this article are not responsible for any financial loss that may occur from investing in or trading. Please do your research before making any financial decisions.



