
 Doge Pepe
 Bitway
 Pons
Pons Sui
Sui Pearl
Pearl Ronin
Ronin Zcash
Zcash
Key Insights:
- Ethena price has been under pressure as 140M ENA exit exchanges without a bullish reversal
- Leveraged traders inject capital to prevent ENA liquidation during a severe drop
- Analysts divided along ENA path: break above $1.5 resistance or fall to $0.50
Ethena price has experienced downward pressure in recent days. Although the supply of exchange has reduced considerably, there has been a further decline in the market. Analysts are split, with some seeing further risk-on potential and others expecting a recovery should there be a retracement.
ENA Price Under Pressure as Exchange Supply Declines
Ali Charts reported that more than 140 million Ethena tokens were withdrawn from exchanges in the past 96 hours. This is typically reflective of decreased selling activity as tokens removed from exchanges are often longer-term holdings. Yet ENA price has dropped sharply, recently slipping toward the $0.64 level.
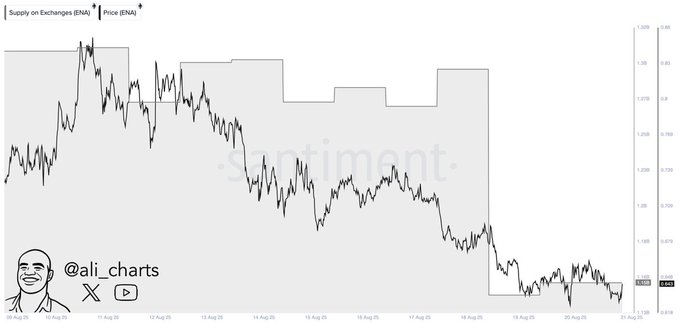
The decrease indicated that outside exchange accumulation had been insufficient to counter prevailing market weakness. The chart revealed that the selling momentum was consistent, even with the decline in circulating exchange balances. Traders see the $0.60 to $0.50 as viable, and any lower break could cause substantial further losses.
Trader Struggles Amid Long Position Losses
Lookonchain data indicated the exposure of one of the most exposed traders in the market. According to his update, trader 0x2611 is down more than $1.85 million on a heavily leveraged ENA long. As liquidation levels neared, the trader added 1.7 million USDC into Hyperliquid to maintain the position.
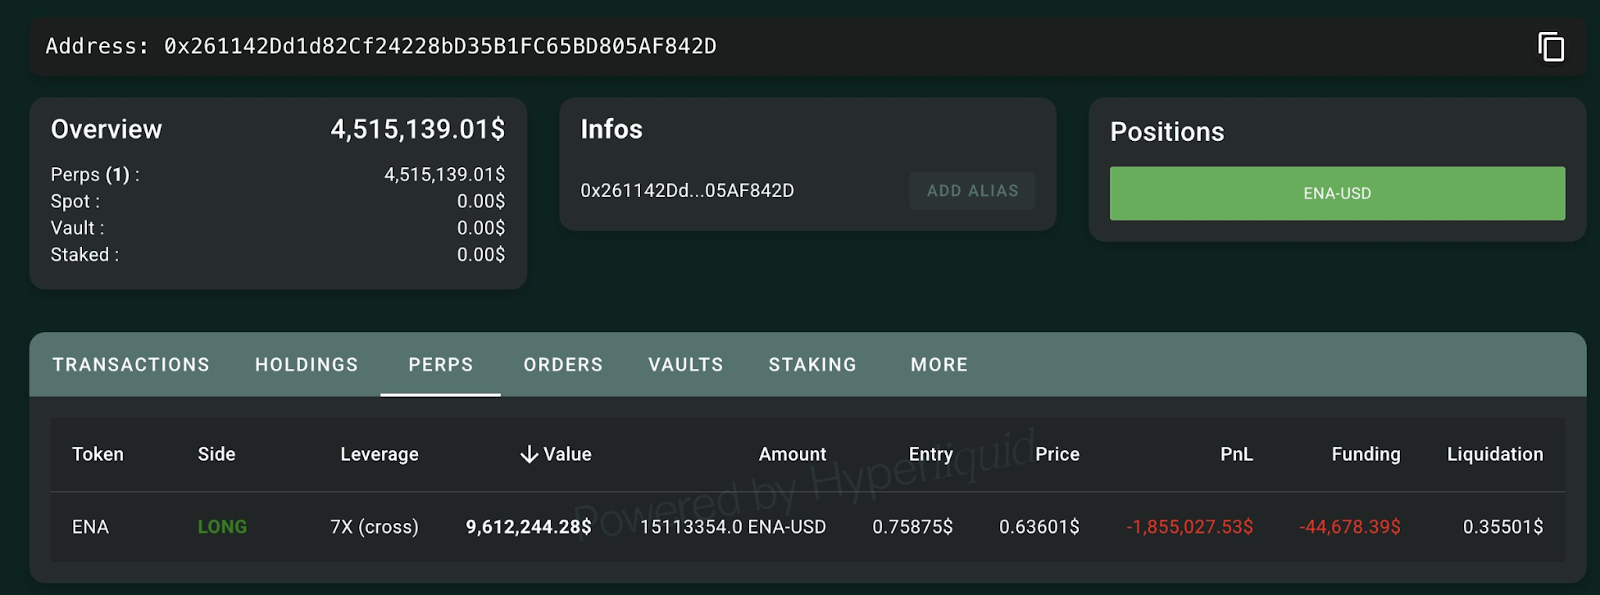
This move underscored the growing pressure on long traders as the Ethena price drifts lower. An increase in collateral can only delay liquidation, but not reduce risk to the overall exposure. The prices are pressured, and forced liquidations are possible, lowering prices. Investors are also keen on levered positions, as these accounts often trigger price actions in corrections.
Fibonacci Levels Highlight Key Support Zones
CryptoPulse noted that ENA was rejected at the 0.5 Fibonacci retracement level. This level is usually a significant turnaround point during retracement. After this rejection, the token declined and is currently seeking support at $0.67 to $0.70.
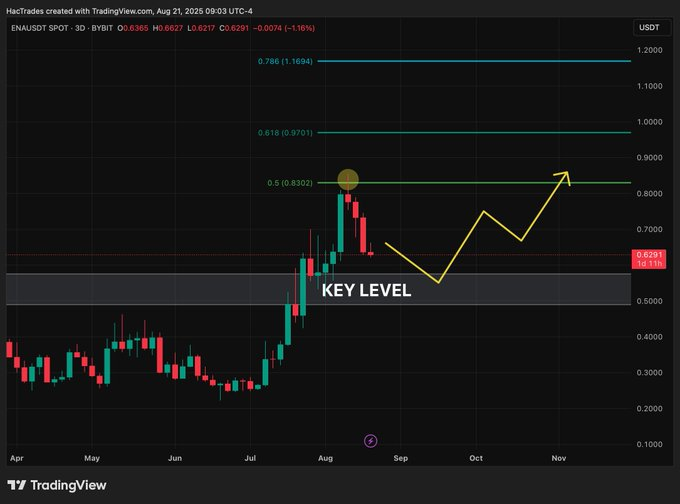
As long as Ethena price can retain this zone, it can rebound to the range of $0.83-$0.97. This bounce would align greatly with general retracement trends and restore bullish momentum.
However, a deeper retracement can occur in the event of a failure, and prices may decline to new lows below $0.50. Traders are therefore keen on this level, which can be used to establish whether the correction is stabilizing or will continue to increase.
At the time of writing, Ethena price was $0.65, 11.47% down in the last 7 days. It also possesses a market cap of $4.36 billion and a trade volume of $511 million over the last 24 hours, showing a decreasing interest.
Despite short-term losses, ENA shows strong fundamentals, with a total value locked (TVL) of $11.91 billion.
Long-Term Outlook and Upside Scenarios
Altcoinpedia analysis indicated that the market might still drop to $0.50 before settling. If this level holds as firm support, a rebound could propel ENA price back toward $1.10. This zone continues to form a strong resistance zone on weekly and monthly charts. A rise above $1.10 may serve as a power move, propelling the token towards long-term objectives between the range of $2 and $5.
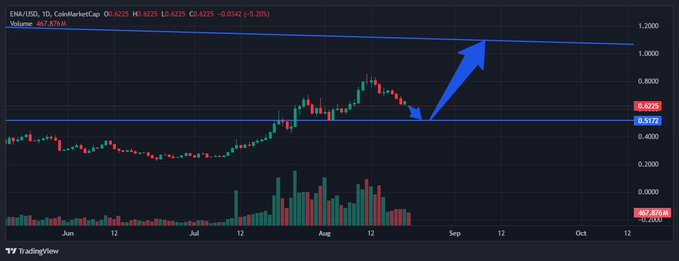
At the same time, Solberg Invest highlighted the larger picture amid recent weakness. The analyst noted that ENA is still up more than 150% this year, demonstrating underlying strength.
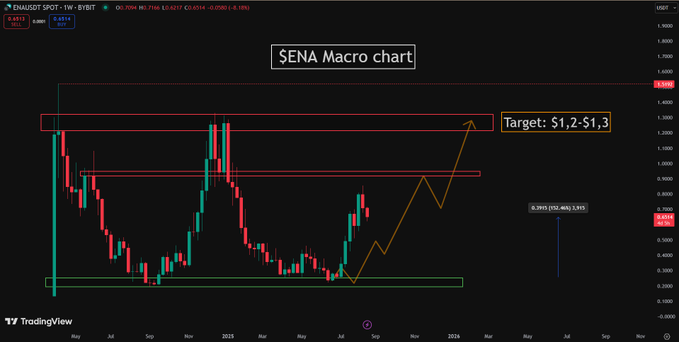
The long-term chart is still bullish, and resistance is marked around $0.90 to $0.95. Solberg places upside targets at $1.2 to $1.5 in case momentum returns as the macro setup favours further growth in the long run.
Disclaimer
This article is for informational purposes only and provides no financial, investment, or other advice. The author or any people mentioned in this article are not responsible for any financial loss that may occur from investing in or trading. Please do your research before making any financial decisions.





