
 Bitcoin
 Pearl
Pearl Quantus
 NEAR Protocol
 Ondo
Ondo Walrus
 Pudgy Penguins

Bitcoin BTC price consolidated within a bullish megaphone pattern on Sept. 24, sparking debate over whether a fresh breakout could push the market back toward $120,000. Traders highlighted the pattern as volatility compressed to historic levels, suggesting that expansion may soon follow.
Traders Watch Bullish Megaphone Setup
Crypto trader Ash Crypto posted that Bitcoin’s daily chart was consolidating inside a bullish megaphone formation. He suggested an upward move could accelerate if the structure played out, potentially carrying BTC toward fresh highs.
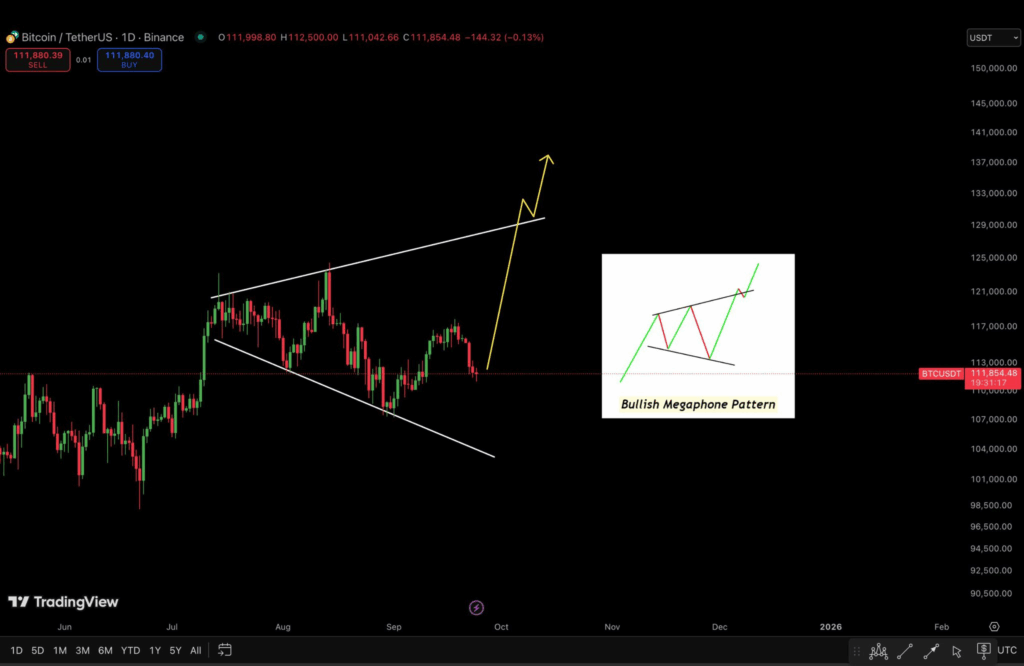
The pattern formed after Bitcoin bounced off support levels around $111,000, reinforcing short-term optimism among technical analysts. Expanding wedges, often called megaphones, typically resolve upward when accompanied by strong liquidity demand.
Bitcoin BTC Key Support at $110K–$112K
Analyst Crypto Rover pointed to liquidity maps showing $110,000–$112,000 as a critical defense zone. “Defend $110K–$112K to capture topside liquidity at $120K. Fail to hold, and the outlook turns bearish,” he wrote.

The comment underscored the importance of near-term support. A loss of this band could trigger a retest of deeper levels, potentially toward $108,000.
That view was echoed by World of Charts, which noted that Bitcoin had already broken short-term support, warning of a possible move toward the $108,000 area if momentum failed to recover.
Tightest Bollinger Bands in History
The broader context showed Bitcoin’s volatility compressing to extremes. Analyst Mr. Anderson observed that the weekly Bollinger Bands were the tightest ever. “When volatility compresses this tightly, expansion always follows,” he wrote. “Once expansion starts, price almost always tests the outer bands rather quickly.”
The indicator measures volatility by tracking standard deviations around a moving average. Historically, such compressions preceded sharp moves in either direction.
Nassar Achkar, strategy chief at CoinW, described the current setup as “the calm before a volatility storm.” He added that negative funding rates, seasonal strength, and exchange-traded fund inflows tilted odds toward a bullish continuation.
Other traders, however, urged caution. CryptoVizArt, a researcher at Glassnode, argued that declining volatility was a natural consequence of Bitcoin’s market maturation. “This is not a signal, this is not an unexpected structure, this is simply an observation without any real predictive value,” he said.
Bitcoin BTC Historical Breakouts Support Bullish View
Bitcoin’s chart history gave bulls some encouragement. When Bollinger Bands last tightened in early July, BTC traded nearly $108,000 before exploding to $122,000 within days.
A similar tightening appeared again in September, reaching the most compressed level ever recorded monthly. For many analysts, the parallel raised the possibility of another breakout if conditions aligned.
Hunters of Web3 founder Langerius stressed that “compression this extreme rarely resolves quietly,” hinting that either direction would bring high volatility.
Seasonal Trend and Uptober Narrative
October remained in focus as traders weighed historical performance. Bitcoin has posted gains in 10 of the past 12 Octobers, giving rise to “Uptober.”
IG Group analyst Tony Sycamore warned that Bitcoin still needed more time to correct. He argued that the asset was still “working off overbought readings” after strong midyear gains.
Even so, market participants circulated CoinGlass data showing that the fourth quarter had delivered gains in eight of the past 12 years. The seasonal pattern bolstered optimism that any short-term downside could give way to renewed upside momentum.
Outlook Hinges on $110K Defense
As of Sept. 24, Bitcoin traded around $111,864, slightly down on the day but above the key support band. The balance between bullish megaphone projections and looming downside risk kept traders split on near-term direction.
Defending $110,000 remained central to bullish hopes. Failure there could validate bearish warnings of a drop toward $108,000 or lower. Conversely, holding firm and breaking higher could unleash the volatility expansion long flagged by compressed Bollinger Bands.
Bitcoin’s price action remains trapped between technical compression and seasonal optimism. Traders continue to watch liquidity maps, chart structures, and institutional inflows for signals that could resolve the standoff.


