
 Puffer
 ZKsync
 Bitcoin
 NEAR Protocol
 Pearl
Pearl Quantus
 Sui
Sui

Ethereum price stabilized after a steep drop, aiming for a break above $4,200. ETH price bounced firmly off the $3,800 support, an essential level of support for any near-term rally. Analysts agreed that keeping this level and reclaiming resistance could increase the next leg.
Ethereum Price Tests Key $3,800 Support
Analyst Ted noted a sharp rebound in the Ethereum price from the $3,800 support zone. It is now nearing the $4,060–$4,200 resistance range. He said that rediscovering this resistance could cause renewed upside movement.
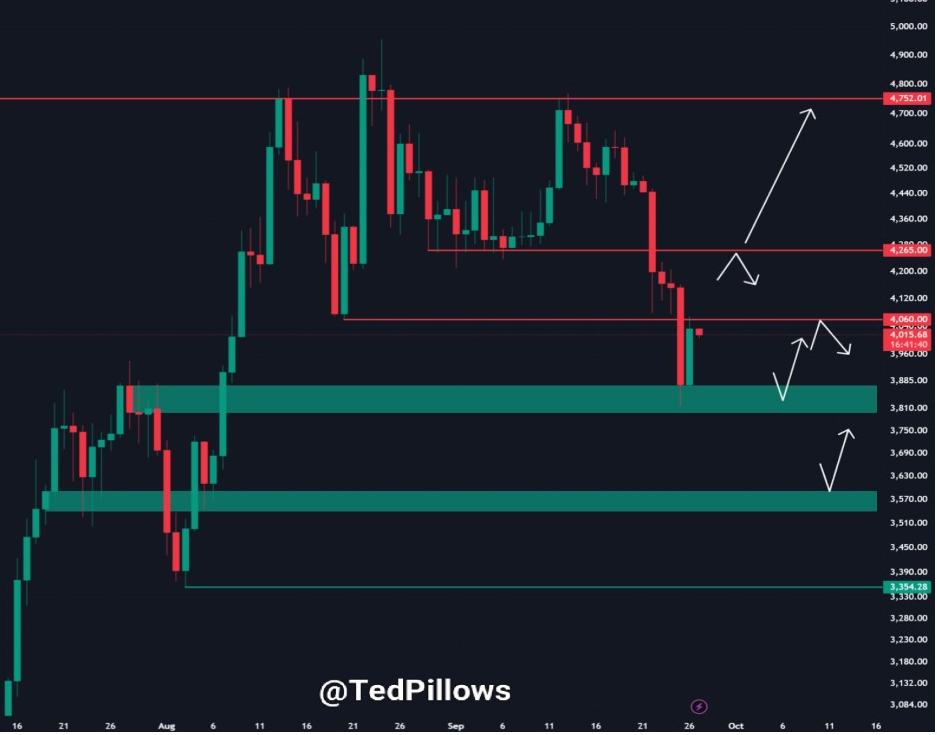
Ted cautioned that if the ETH price breaks through its base of $3,800, it may drop further to $3,600. His chart presented two possible outcomes. The price may surge if the resistance level is broken or fall if the support level fails.
These insights revealed how traders closely monitor the $3,800 level. Holding this price could save the bullish sentiment, while a breakdown could turn the market bearish.
Record ETF Outflows Add Selling Pressure
Meanwhile, BitBull’s analysis of institutional data revealed that the Ethereum ETF had its largest weekly outflow ever. According to the SoSoValue report, total net assets decreased by $795.56 Million to $26.01 Billion.
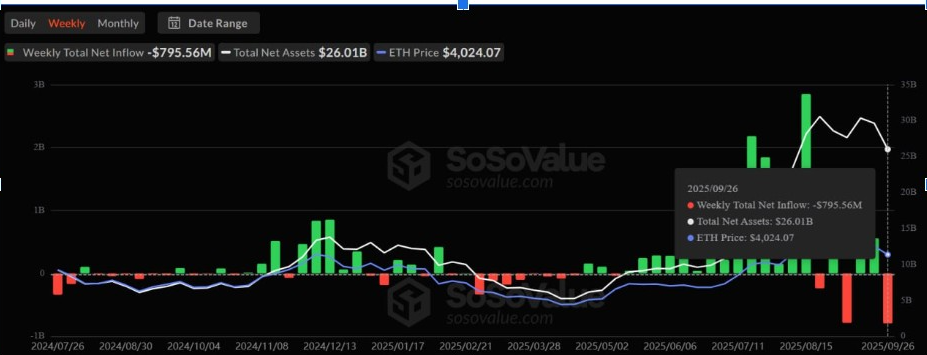
This outflow occurred when the Ethereum price was trading at around $4,024. This suggests investors are making large withdrawals from key ETF products. SoSoValue’s chart displays this week’s decline as the largest single-week withdrawal since Ethereum ETFs began trading.
The perspective highlighted the impact of the ETF’s action on market direction. While substantial outflows sometimes prolong declines, they can also mark the end of a corrective phase.
Market Still Heavy Around $4,200 Resistance
Furthermore, Lennaert Snyder noted that the top altcoin remained above $3,800. However, market action remained heavy. He highlighted $4,200 as an important resistance level for confirmations as shorts or possible long entries after a breakout.
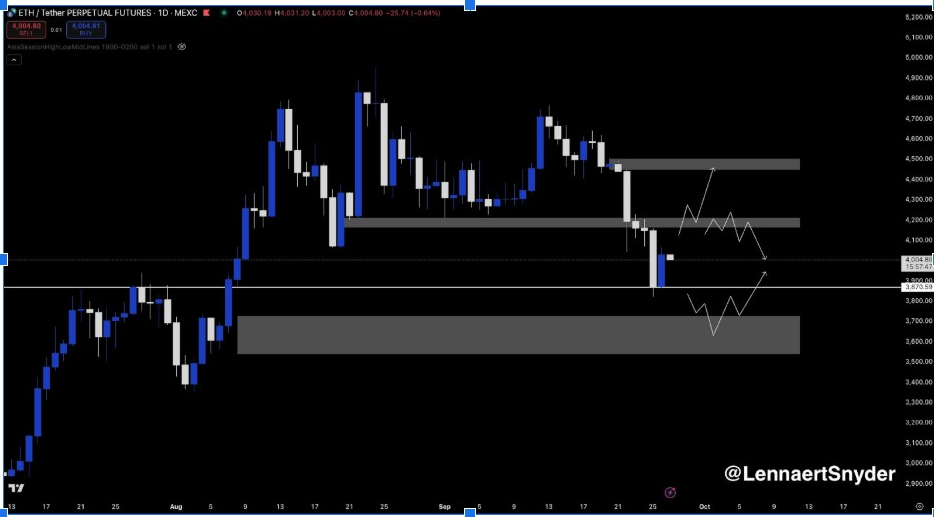
He added that the ETH price may weaken again. If this happens, the $3,600-$3,700 range offers a strong support zone for new buying. His chart suggested possible sideways consolidation before any decisive upward or downward break.
In the meantime, Lennaert emphasized patience, as it is essential to wait for clear indications. Until Ethereum convincingly reclaims the $4,200 mark, another dump remains possible if bullish pressure eases.
Wave Count Suggests ABC Correction May End Soon
Man of Bitcoin used Elliott Wave theory to analyze the structure of Ethereum. It showed an ABC correction pattern in wave 4, forming an upward move. He indicated this corrective phase might be complete if the Ethereum price stays above $3,972.
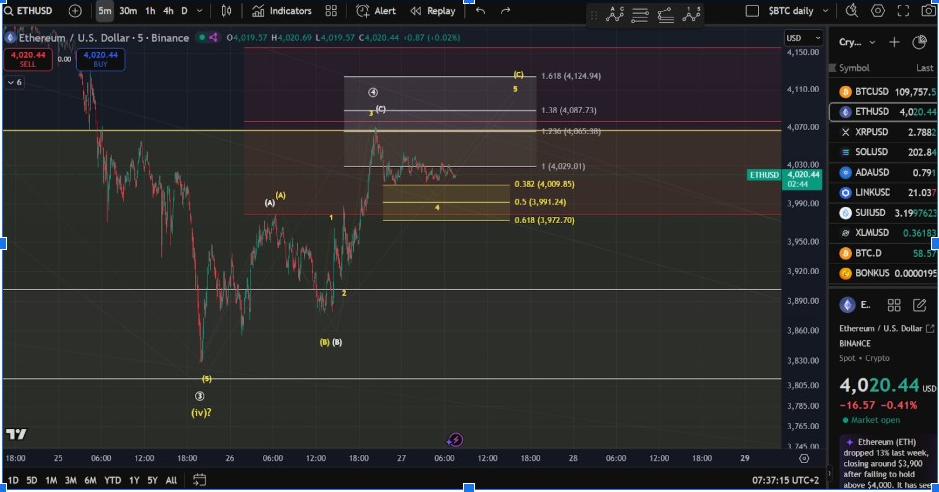
Keeping that support intact could lead to another price spike, with Fibonacci extensions pointing to targets above $4,124. His chart also revealed how a strong, sustained base near $3,972 could fuel the next upward move.
This wave-based view provides a productive counter to short-term prudence. A steady hold above key support might help the Ethereum price launch a new rally sooner than expected.
Bear Trap Pattern Supports Long-term Bulls
Ardizor referred to the latest sell-off as a massive bear trap and advised traders not to get shaken out. His chart displayed earlier bear traps that preceded strong Ethereum price recoveries.
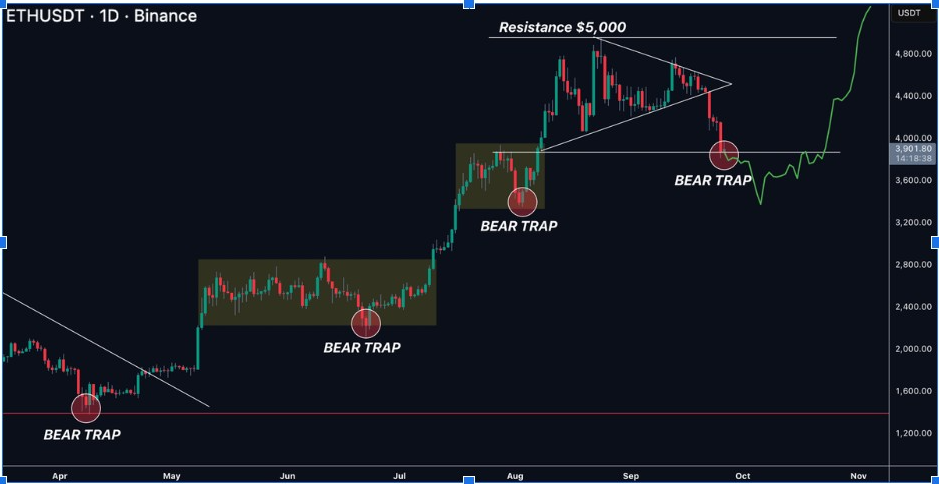
He displayed a bullish path for a breakout towards the $5,000 resistance, compared to previous breakouts following similar market setups.
Ardizor’s long-term analysis indicated that, despite recent volatility, the Ethereum price may continue the broader uptrend. If the pattern repeats, the market could bounce back rapidly and reach new highs.


