
 Puffer
 ZKsync
 Bitcoin
 NEAR Protocol
 Pearl
Pearl Quantus
 Sui
Sui

Ethereum price is consolidating just below key $4,000 level, as traders await a decisive breakout. Bears still dominate the market, analysts say, and any next move by the Federal Reserve could change sentiment. Despite a weak weekend, the market is looking ahead to greater strength in the forthcoming sessions.
Ethereum Below $4,000 as Traders Wait for Catalyst
Ethereum price still stays within a narrow range of $3,850 – $3,990. Ted pointed out that the ETH price is still heavily resisted near $4,000, which indicates that short-term traders are being cautious.
He further stated that discussions on the Federal Reserve’s termination of quantitative tightening (QT) next week could be a significant spark. If confirmed, the policy change has the potential to bring new liquidity to the markets and create a bullish breakout in Ethereum price.
Ted’s chart showed resistance at $4,075 and $4,250, and support at $3,780 and $3,550. A daily high above $4,000 would be confirmatory of renewed momentum and could drive price enlargement towards upper resistance bands.
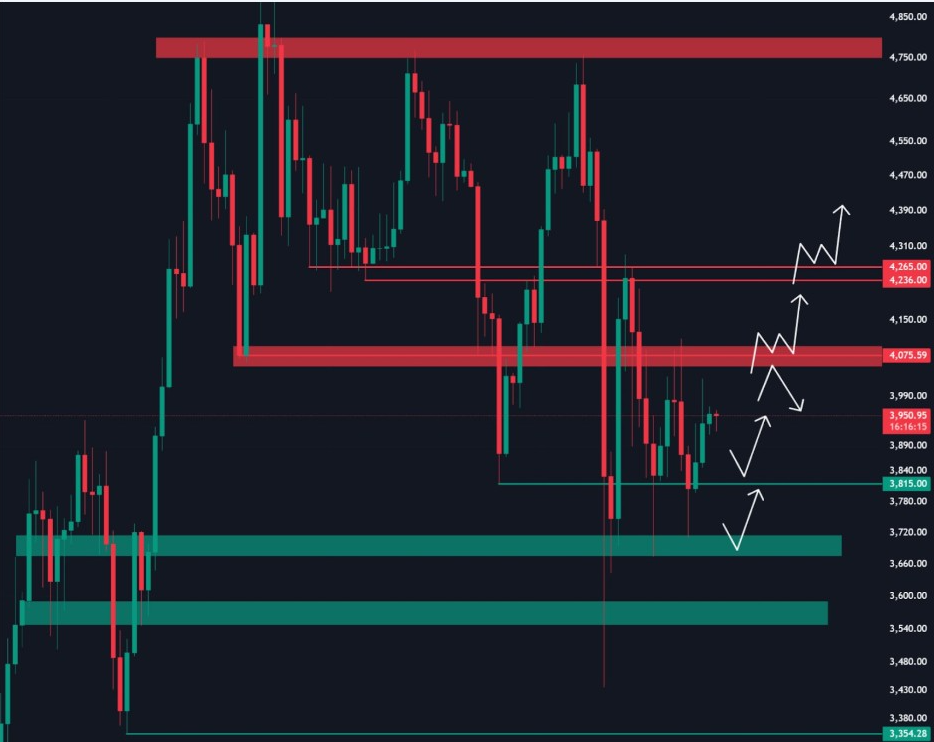
The structure also revealed that Ethereum price has had its mid-range support for more than two weeks. This pattern could signal market stability before a larger move in either direction.
Analysts Highlight Key Levels for Ethereum’s Next Move
Analyst Lennaert Snyder noted that Ethereum price is once again hitting the $4,030 resistance level. According to him, the price may move above this area, leading to a move toward the compression zone near $4,250.
Snyder also emphasized the importance of maintaining support around $3,950, which has served as a reliable bounce level. He cautioned that losing $3,920 may nullify the short-term bullish setup and invite more serious selling pressure.
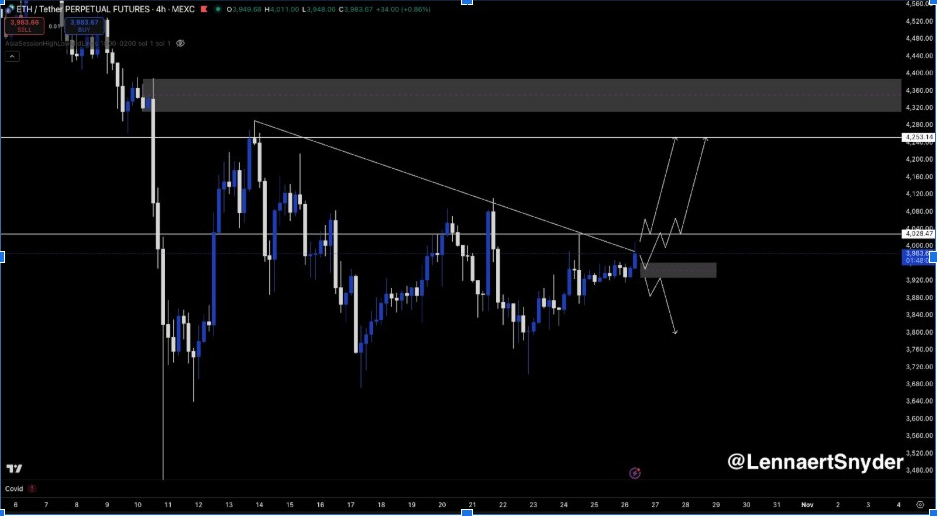
The analyst’s 4-hour chart revealed ETH price making higher lows since mid-October. This pattern indicates increasing pressure of accumulation, with potential upside once resistance is broken.
Snyder’s forecast is cautiously bullish, provided it holds above $3,950 and closes higher on a daily basis. Traders are closely monitoring this range as a potential area of breakout confirmation.
Institutional Demand and Market Dynamics
Even after being quiet in terms of its consolidation, Ethereum is still attracting institutional attention as well. Data from Glassnode showed that Ethereum outperformed Bitcoin in Q3 2025 inflows, with more than $9 billion directed to Ethereum ETFs compared to $8 billion for Bitcoin ETFs.
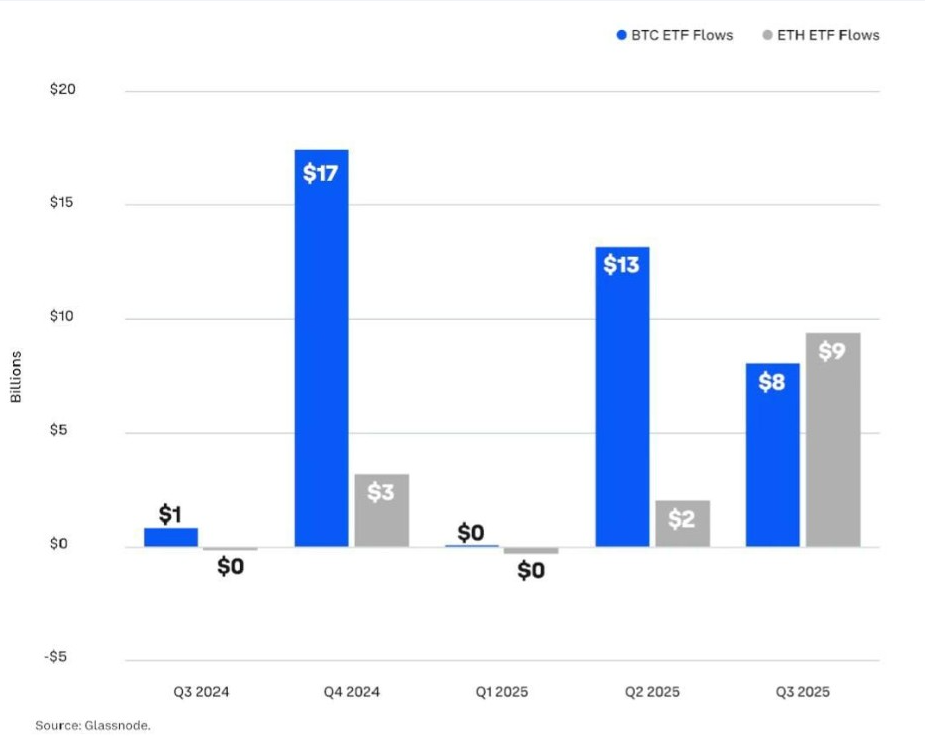
This shift reflects the increasing institutional preference for Ethereum and its rapidly expanding ecosystem, including DeFi, tokenization, and Layer 2 scaling. The data also suggests a steady increase in long-term holders, which could have the effect of providing support at key levels.
Analysts suggest that these inflows reflect a wider confidence in Ethereum’s fundamentals, rather than short-term trading sentiment. The network’s ability to attract institutional capital during a consolidating market suggests resilience and maturity.
If the upcoming Federal Reserve announcement lessens liquidity tightening, institutional demand could potentially pick up and drive Ethereum price to new highs.
Technical Indicators Suggest Bullish Continuation Potential
Ethereum’s technical setup stays in line with a bullish flag formation, according to Donald Dean and several traders. The structure draws attention to targets around $ 4,500 and $4,955, with extended projections to $5,766 based on Fibonacci extensions.
Trading volume around the $3,825 zone has been increasing, indicating strong buying interest. The volume profile of a chart suggests a “base-building” phase preceding an upward expansion.
Moreover, the RSI and the MACD indicators remain in neutral zones with room for renewed momentum with no overbought signs. A breakout of $4,000 with volume confirmation may confirm this setup.



