
 Bitcoin
 NEAR Protocol
 Pudgy Penguins
 Puffer
 ZKsync
 Bitway
 Pearl
Pearl

The Bitcoin price has been trending upward in recent days, and some analysts believe the top cryptocurrency could continue to rise if buyers maintain support above the current range.
Traders are watching the $114,000 area, as a move above that zone could open a path toward $118,000.
Notably, others are paying attention to technical signals that show both strength and caution.
Bitcoin Price Short-Term Trend Shows Steady Buying Interest
Bitcoin has been rising for several days, and its price action has gained attention from the market.
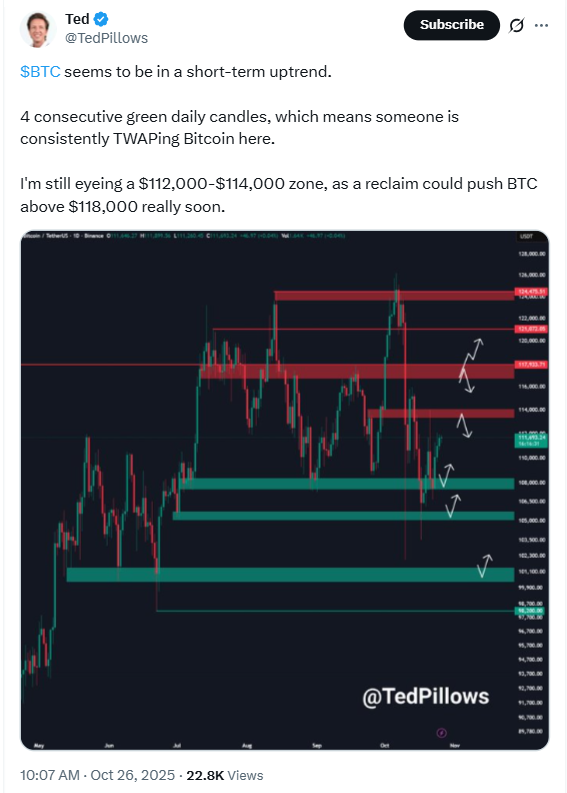
The cryptocurrency recorded four consecutive green daily candles. Analyst Ted Pillows said this pattern shows that someone may be buying Bitcoin in a steady and controlled way.
It is also important to note that he explained the buying looks planned rather than sudden.
Based on this outlook, he is watching the $112,000 to $114,000 area as an important level.
If Bitcoin price climbs back into that zone and holds, he believes it could move above $118,000 soon.
Meanwhile, market data support the idea that more people expect the price to move upward.
Coinglass numbers indicate that long trades now account for 55.45% of open positions. This means more traders are betting that the price will rise rather than fall.
A large trader also opened a big position with 40 times leverage on $16.6 million worth of Bitcoin.
That is a big commitment and suggests confidence, although high leverage always brings high risk.
Even with the upward momentum, there are still signs that the market is not comfortable.
For example, the trading pattern resembles a megaphone shape, indicating that Bitcoin price swings are becoming wider.
Essentially, this shape often appears when the market is uncertain and can lead to sharp moves in either direction.
Analysts at CryptoQuant noted that volatility is currently very low, and activity is slower. They noted that this often happens before a strong move.
Bollinger Comments While Traders Study The Chart
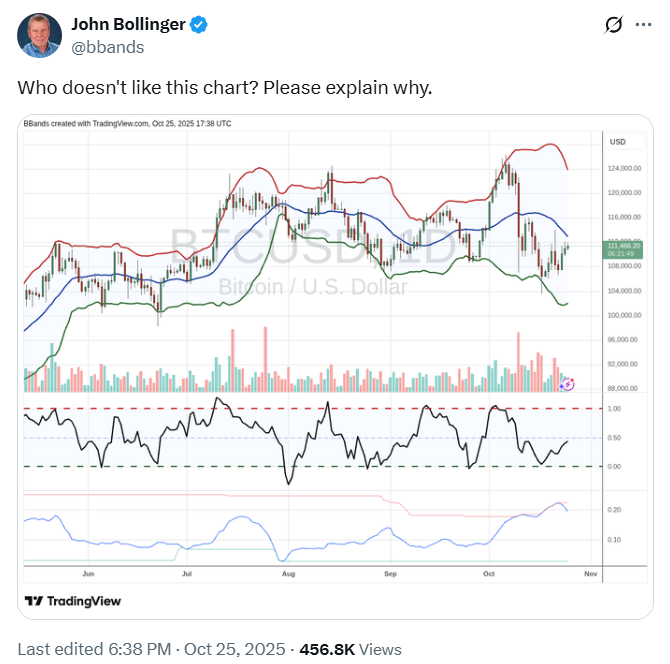
Well-known analyst John Bollinger shared a chart and asked why people would dislike the current setup.
Bitcoin price remains above the $110,000 area, keeping buyers active.
His view suggests that the market still has support and that the current pullback has not deterred buyers from their interest.
At the same time, he recently mentioned that Solana and Ethereum are closer to forming a bottom.
However, he did not give the same view about Bitcoin. That difference shows that he sees more uncertainty in Bitcoin at the moment.
Similarly, other traders have reacted to his comments. Josh Olszewicz said that megaphone patterns are not enjoyable to trade because they make direction harder to read.
Another market observer noted that the Bitcoin price is below a key support and resistance line, and the RSI level is below 50.
When the RSI drops below that point, it may show fading strength if buyers do not return.
Key Support Zones Remain In Focus
Titan of Crypto discussed the long-term view using the Ichimoku Cloud indicator. He said Bitcoin price still looks strong on the monthly chart.
The trend has not touched the red Tenkan line, which means the larger trend is still pointing upward.
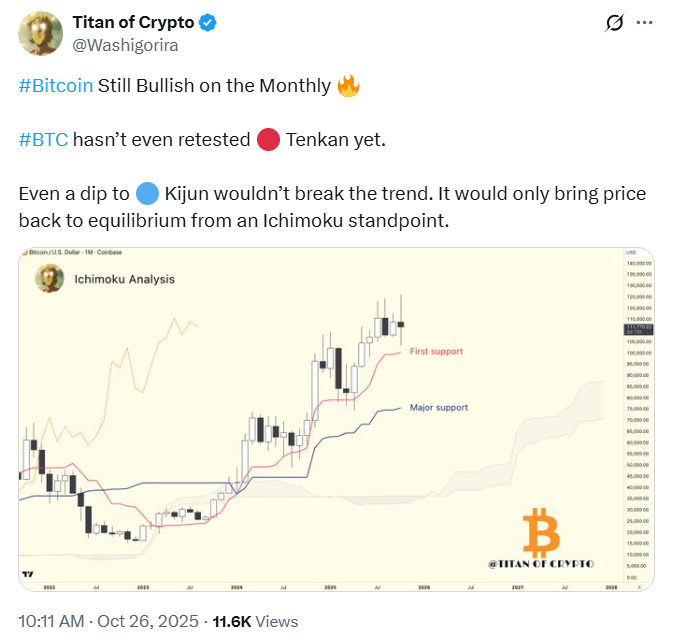
Even if the price moves down to the blue Kijun line, he explained that the long-term structure would remain healthy because that line represents balance and fair value.
Additionally, support levels continue to shape expectations. As of the time of writing, BTC is trading at $113,410.43.
Many traders are watching to see if the BTC price can stay above $110,000 and then climb back into the $112,000 to $114,000 zone.
If that happens, confidence may grow, leading to a stronger push higher. If Bitcoin continues to slide under support and RSI weakness persists, selling pressure could increase.



