
 Puffer
 Bitcoin
 ZKsync
 NEAR Protocol
 Walrus
 Pearl
Pearl Ondo
Ondo

HBAR crypto is showing renewed bullish strength as traders expect a potential 60% breakout. Several analysts are pointing to some solid technical patterns and significant catalysts that are creating optimism. The recent listing of the Canary HBAR ETF on Nasdaq has further added momentum to HBAR’s bullish outlook.
HBAR Crypto Sets Up for Breakout Move
Zayk Charts noted that HBAR Crypto is preparing for a major breakout after weeks of consolidation. The 8-hour chart showed price bouncing within a bearish channel, and with recent gains, it is rising towards $0.205.
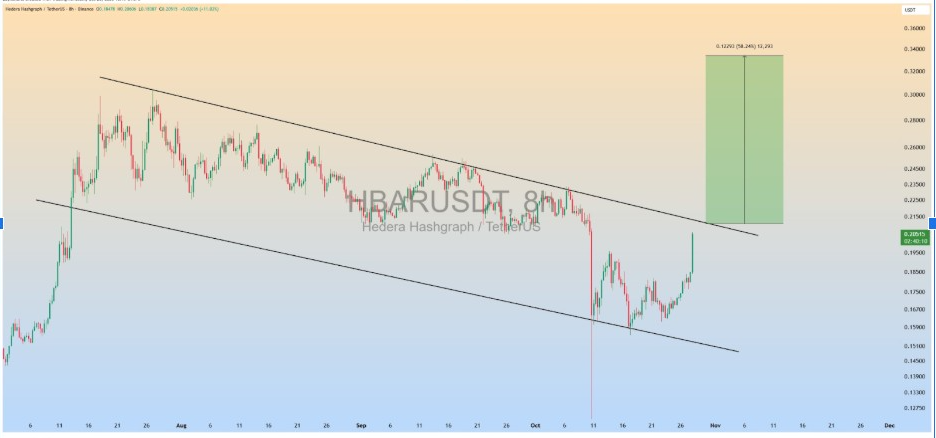
Bulls were trying to regain control, and the upper boundary of the pattern is now facing pressure. A breakout above $0.205 could serve as the catalyst for a significant 50-60% rally towards the $0.32-$0.35 region. The setup is consistent with a bullish momentum change and supported by steady higher lows and increasing trading volume.
Zayk Charts highlighted that a clean close above resistance would confirm a strong reversal. This move suggests that the next move in HBAR is likely to be bullish, potentially topping off one of the multi-week corrections. If the momentum persists, the price is likely to gain momentum in the coming sessions.
ETF Launch Drives Institutional Flow
Mark Chadwick affirmed that Nasdaq has officially posted the listing circular for the Canary HBAR ETF (Ticker: HBR). The fund began trading on October 28, 2025, and offers direct spot exposure to HBAR. This product will enable institutions to hold HBAR in regulated custody through BitGo and Coinbase Custody.
The launch of the ETF is a significant milestone for the Hedera network, paving the way for institutional capital. It confirms the project maturity and market confidence at a time of increased appetite for compliant digital assets. Chadwick said the ETF is priced using CoinDesk Indices, which he said has a transparent valuation and regulated tracking process.
This institutional access would change the liquidity structure in HBAR. This institutional access may change the liquidity structure of HBAR. Historical data of similar ETF launches, such as Bitcoin and Ethereum, show that such incidents have often led to massive inflows. With the ETF now live, it is expected that there will be more demand, strengthening the breakout structure.
Fractal Pattern Suggests Long-Term Upside
ChartNerd noted that HBAR crypto was potentially following a historical pattern similar to its 2021 rally. The chart used Elliott Wave counts to define a potential five-wave structure with a long-term projection around $1.80.
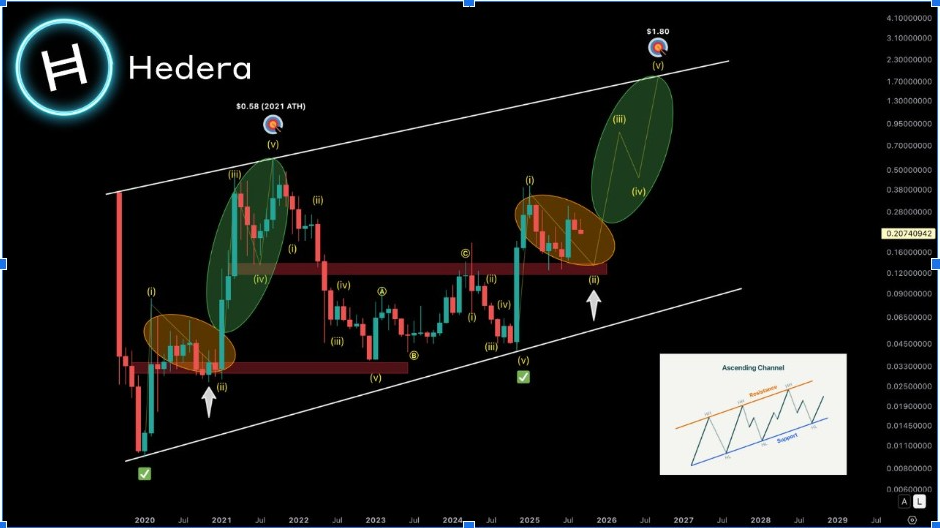
The model revealed that HBAR crypto has recently undergone a corrective phase and is now entering a new impulsive sequence. Historically, once the consolidation is over, the token tends to grow exponentially to the resistance levels.
According to ChartNerd’s analysis, the fractal also reflected cyclical investor behavior on Hedera’s market. Each impulse wave corresponds to a sharp increase in network activity and investor attention. The projection showed that HBAR price could gradually move towards $0.70 before attempting higher extensions near $1.80.
Weekly Outlook Identifies Key Levels
CryptoPulse shared HBAR’s weekly outlook, with some early signs of buyer re-entry. The price is testing the $0.205 key level, which is a key breakout confirmation zone.
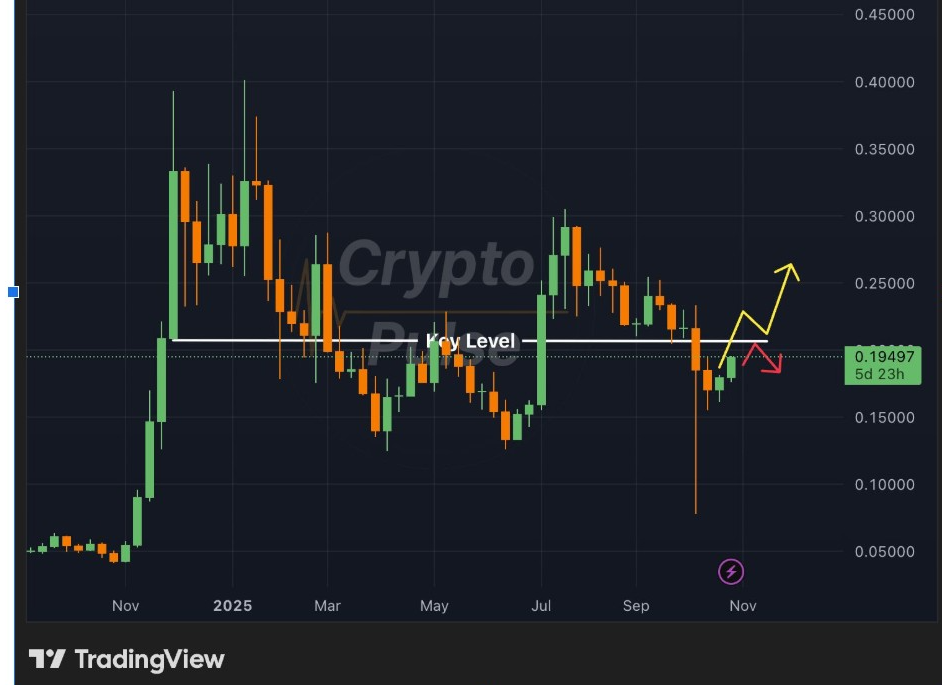
The bullish scenario implied that a confirmed close above $0.205 could open room toward $0.29 and possibly higher. A rejection, on the other hand, might push the token back toward support at $0.13. Despite this risk, structural strength within the market is still improving as accumulation patterns reemerge.
Buyers are slowly regaining pace following a prolonged downtrend. The weekly chart showed higher lows, confirming the bullish bias of other analysts. Continuous demand above $0.19 will confirm the breakout theory, strengthening the potential for a major move.



