
 NEAR Protocol
 Bitcoin
 Puffer
 Hyperliquid
 ZKsync
 Pudgy Penguins
 Pearl
Pearl

Ethereum price has once again lost its $4,000 support level, sparking debate about its next course of action. The selloff followed the Federal Reserve’s 25-basis-point rate cut and the announcement of fresh U.S.-China trade talks.
Despite these macro developments, the outlook for the ETH price remains mixed as traders consider technical and liquidity signals.
Market Volatility Returns As Ethereum Price Breaks the $4K Mark
Ethereum price is below $4,000, triggering fear among traders again. Ted commented that this area has provided strong support throughout the year. The recent downtrend occurred during favorable macro conditions. However, the ETH price failed to sustain the move.
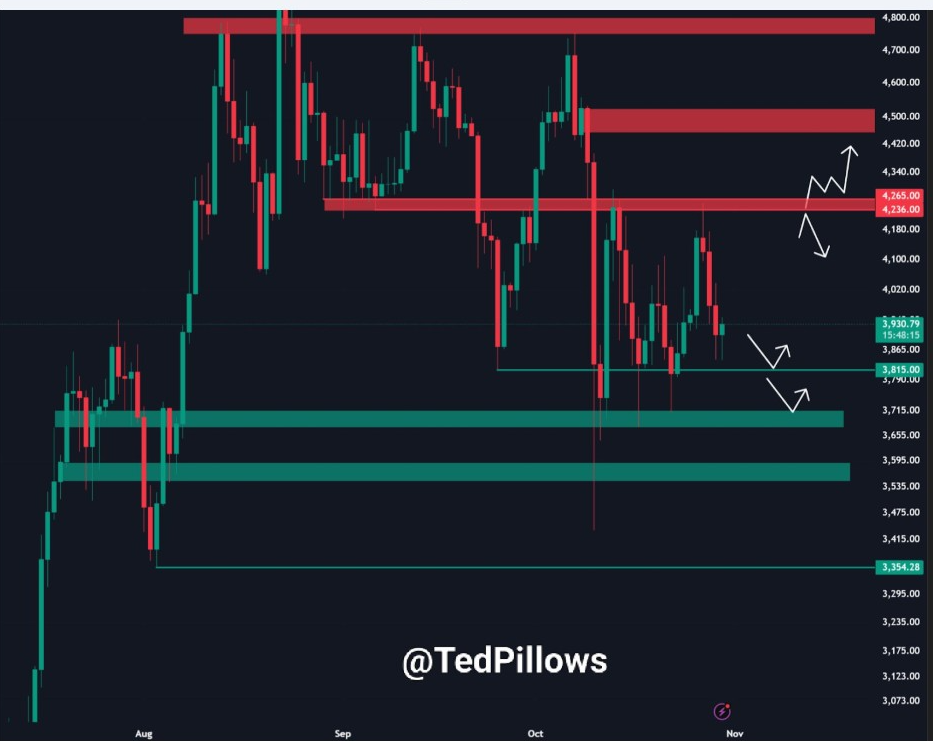
Ted pointed to resistance ranges between $4,180 and $4,340, with downside support between $3,815 and $3,650. He warned that the inability to recover $4,000 would be a confirmation of weakness. A rapid recovery could transform this into a bear trap.
According to Hyperbot data, long exposure on BTC, SOL, and ETH is approximately $275 million. Ethereum accounts for $52.5 millionkk of that amount, with an unrealized profit of 6.77%.
However, the total return on equity remains negative at -6.71%. This indicates that, despite the leveraged position, confidence in the markets has decreased.
Fed Liquidity Policy May Determine Crypto Direction
Ted made a further comparison between the current setup and the 2019 market cycle. At the time, altcoins fell 42% after the Fed removed quantitative tightening (QT). A recovery only began when quantitative easing (QE) started in March 2020.
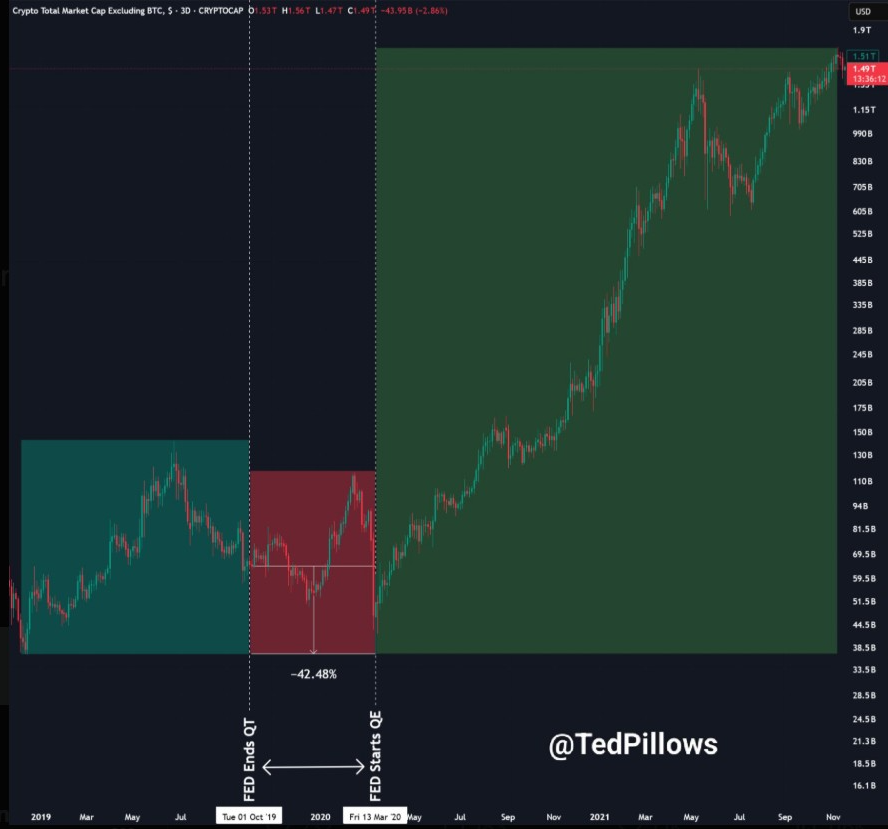
Historically, this trend suggests that the mere cessation of QT may not have a positive impact on crypto valuations. Liquidity injections (via new QE or Treasury General Account (TGA) issuance) are pivotal. Ted cautioned that Ethereum and other assets would suffer stagnation without new liquidity.
The current US government shutdown has delayed possible Treasury revenues. Ted believed that this would continue to weigh on risk assets. While the S&P 500 is likely to recover more quickly, cryptocurrencies could lag until liquidity conditions improve.
Ethereum Trendline Continues to Strengthen
Despite the recent correction, the long-term structure of the Ethereum price has remained unchanged. Trader Tribe pointed out that ETH is still respecting its uptrending support line.
The central support zone is between $3,600 and $3,700. Additionally, it could serve as a foundation to build upon for the next level up.
If the ETH price breaks out, a bullish move could follow. The target is a year-end push toward $4,800. As a result, the trend continues the overall upward trend, characterized by a favorable market structure.
Another analyst, Batman, echoed this optimism. Ethereum is retesting its diagonal support again. It’s also approaching a level called the King of Leverage setup. Based on his chart, a successful bounce would be a 39% rally of $5,500.
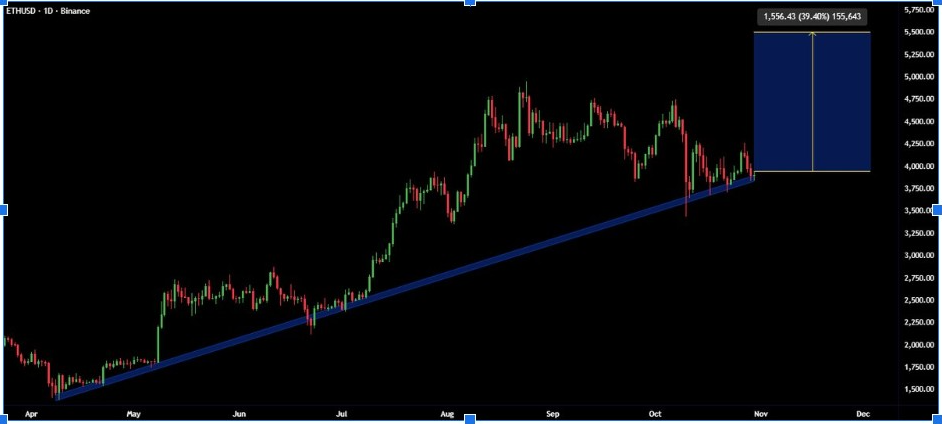
Batman believes that the Ethereum price could reach $5,500. This depends on holding its current level and surpassing its previous all-time high.
This forecast is consistent with past breakouts that have followed retests of trendlines. This level has become a possible turning point for bulls.
On-Chain Metrics Suggest Fundamental Network Strength
Ethereum’s network activity continues to rise despite short-term price fluctuations. CryptoPatel provided data indicating that Layer-1 transactions and active addresses have reached new all-time highs. Gas fees, in turn, are low, indicating more efficient systems.
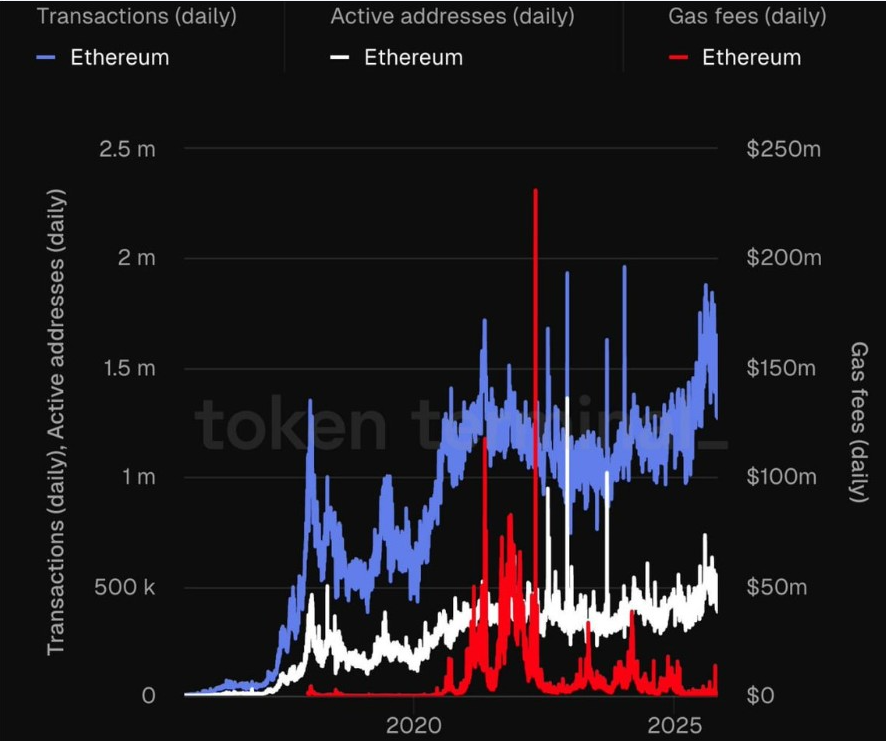
These on-chain indicators demonstrate a robust adoption and continued ecosystem activity. Daily transactions are steadily increasing. This reflects strong engagement from developers and users, supporting Ethereum’s long-term sustainability.
Ethereum’s network remains one of the most active and efficient in the market. This long-term upward trend reflects strengthening fundamentals. Market sentiment may align once liquidity returns.


