
 Doge Pepe
 Bitway
 Pons
Pons Sui
Sui Pearl
Pearl Ronin
Ronin Zcash
Zcash

Hedera Hashgraph (HBAR) is becoming a really crucial blockchain despite its price action struggling. HBAR crypto has had a smooth entry into institutional recognition after the launch of HBAR ETF late last week. However, the ETF hype has not been enough to reignite a price discovery.
Other metrics of HBAR crypto were performing well, for instance, volume, which complemented the robustness seen in HBAR ETF inflows. The analysis will reveal potential developments surrounding HBAR crypto, with a classic long squeeze anticipated.
HBAR Crypto News: HBAR ETF Inflows and Volume Surge
HBAR crypto registered its sixth consecutive day of total net ETF inflows of approximately $1.92 million, which translates to approximately 66.69 million assets. The price of Hedera crypto was at $0.18 at the time of the release of this crypto news by the SoSoValue analytic tool.
As seen on the chart, October 30th had the largest inflows, amounting to approximately $30 million, with more than 33.05 million HBAR purchased. The second-largest was November 3rd, when the HBAR ETF saw approximately $22 million in net inflows.
Generally, the HBAR ETF has been experiencing positive inflows since its launch, despite seeing very minimal capital inflows over the last two days. However, November 5th was higher than the previous day, which had $1.57 million.
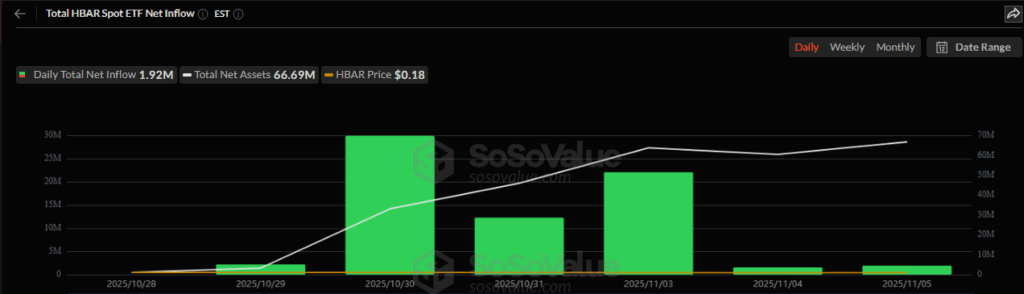
The cumulative total net inflow after the six days was at $69.93 million. This indicated that the ETF had gained recognition from institutions and traditional traders on Wall Street, even though the impact had not been translated into price changes.
The monthly volume for HBAR crypto was following in the footsteps of ETF inflows. According to data from DefiLlama, the month of October surpassed the $10 billion mark, indicating that participants were taking notice of the altcoin. This was a quiet show of immense network activity, but can it align with the broader Layer 1 (L1) market recovery? The answers rested in its price action.
Why Is HBAR Crypto Price Weak?
The price action chart of HBAR cryptocurrency indicated a weak market amid thriving ETF inflows and high monthly volume. The altcoin was trading below both the 50 EMA and the descending trendline resistance.
The low for HBAR crypto in the market structure since May 1st was at $0.080, slightly below the $0.10 mark. The RSI and MACD were all aligning with bearish sentiments. The RSI was approaching oversold conditions, while the MACD had flipped back to negative territory. These readings meant that sellers were responsible for the price movements.
The weakness was the lack of strong buyers while sellers gained momentum with every rejection at the upper resistance level. If this continued, the path toward levels below $0.10 could become imminent.
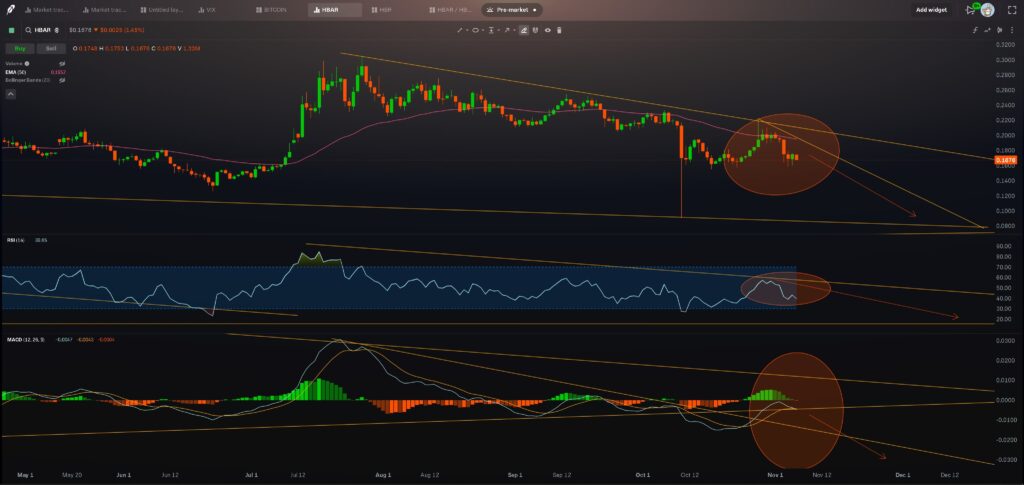
Alternatively, reclaiming the 50 EMA, along with the declining resistance, could shift the market structure back to bullish. However, the liquidation leverage heatmap analysis supported the dip.
Assessing Liquidation Magnet for Hedera Crypto
Assessing the liquidity of HBAR crypto, there was a potential long squeeze. This emanated from the high liquidity cluster at $0.16, which meant longs were concentrated at this level.
Therefore, due to the tendency of price to follow liquidity, a dip to this level was viable. This would trigger a long squeeze, leading to a further drop, potentially revisiting $0.10 or lower. On the other hand, there was less liquidity above, meaning a move higher was less likely.
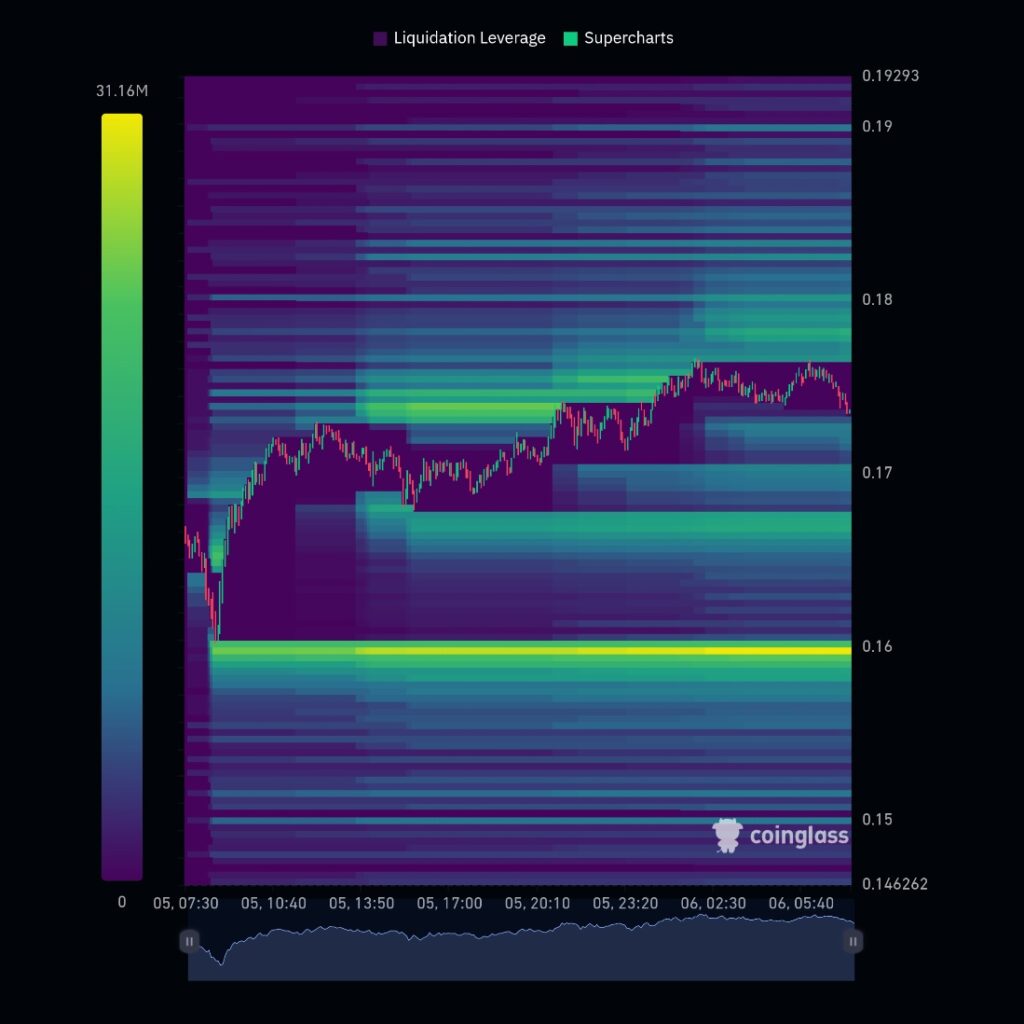
Altogether, the strength in network activity and ETF inflows was insufficient to support the struggling price. The structure was bearish but a long squeeze could trigger more decline or spark a reversal to the upside.





