Dacity Coin
 streamoors
 Celestia
 Injective
 Quantus
 Pudgy Penguins
 Pearl
Pearl

Ethereum (ETH) hovered near $3,365 on Nov. 7 after whale outflows triggered renewed volatility, according to TradingView data. The move came as sentiment flipped sharply bullish, with traders calling sub-$4,000 prices “a gift” while others warned of a potential trap.
Ethereum ETH Price Tests Key Support as Whale Activity Sparks Debate
The Ethereum price hovered near $3,360 on Nov. 7 after another failed attempt to reclaim the $3,500 zone. Traders are split between renewed bullish calls and warnings of further downside, as whale transactions and on-chain sentiment data paint a mixed picture.
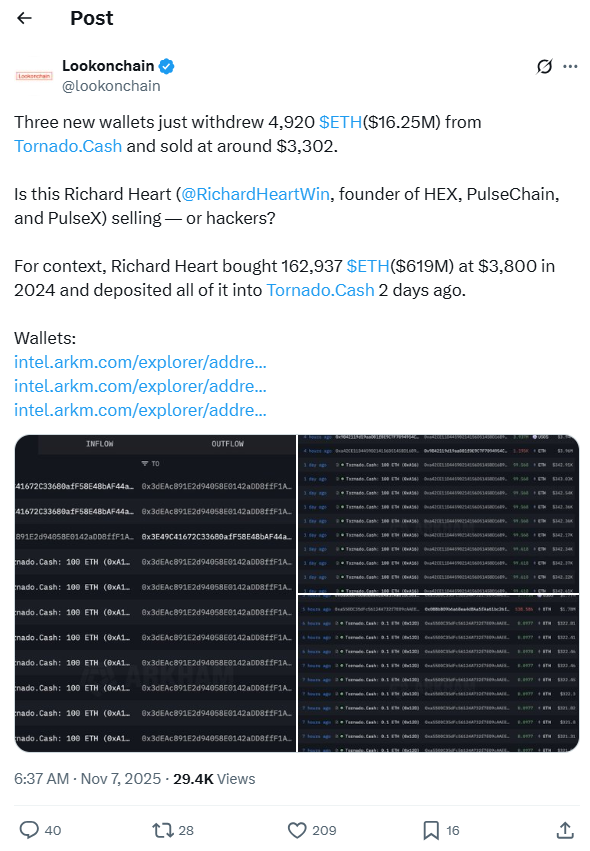
The latest volatility followed a 4,920 ETH dump worth $16.25 million, as highlighted by Lookonchain, after three new wallets moved funds from Tornado Cash and sold for nearly $3,302. The on-chain tracker raised questions about whether the seller was HEX founder Richard Heart or unknown hackers. Heart previously bought 162,937 ETH at $3,800 in 2024 and deposited the entire stack into Tornado Cash two days before the sale.
Meanwhile, traders on X offered sharply opposing outlooks. Some called the current consolidation a rare buying opportunity. Others warned that bulls had not yet regained control of the trend.
Traders Call Sub-$4K ETH “Easiest Buy” — But OBV Says Otherwise
AltcoinGordon posted that buying ETH below $4,000 was “the easiest thing you can do in crypto right now,” adding that “most have lost hope” ahead of what he described as a coming bear “massacre.” His view aligned with growing bullish sentiment data noted by analytics firm Santiment.
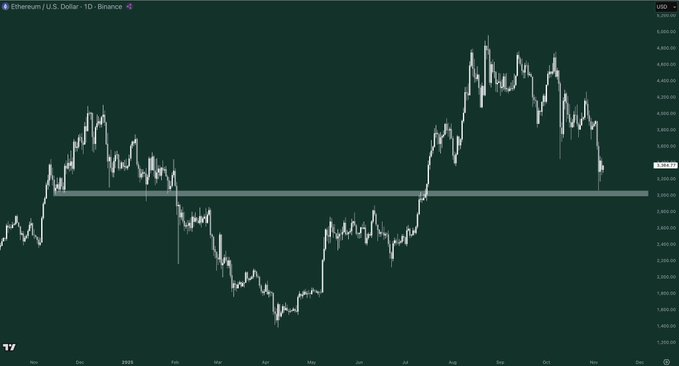
Santiment reported that Ethereum’s crowd sentiment “flipped fast” into extreme bullishness. The firm cautioned that ETH “usually moves against the herd” when retail traders turn confident too quickly.
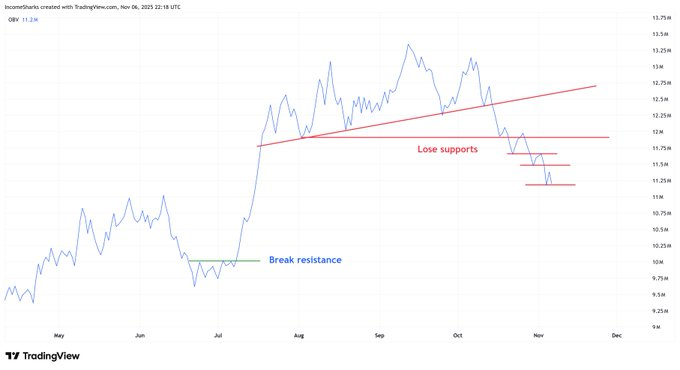
IncomeSharks disagreed with the bullish rush. The trader pointed to On-Balance Volume (OBV) weakness, stating ETH remained “in breaking support mode.” He said each bounce “will be called a bottom,” but warned that no reversal existed until OBV confirmed it.
This divergence has framed the market’s current dilemma: between aggressive buyers and data-driven caution.
Whale Selling Meets Downtrend Channel: Ethereum ETH Price Still at Risk
The daily chart showed ETH trading inside a descending parallel channel stretching from the early September high near $4,100. The upper boundary acted as consistent resistance, while the lower trendline positioned potential downside near $2,880 the PF 1 S level.
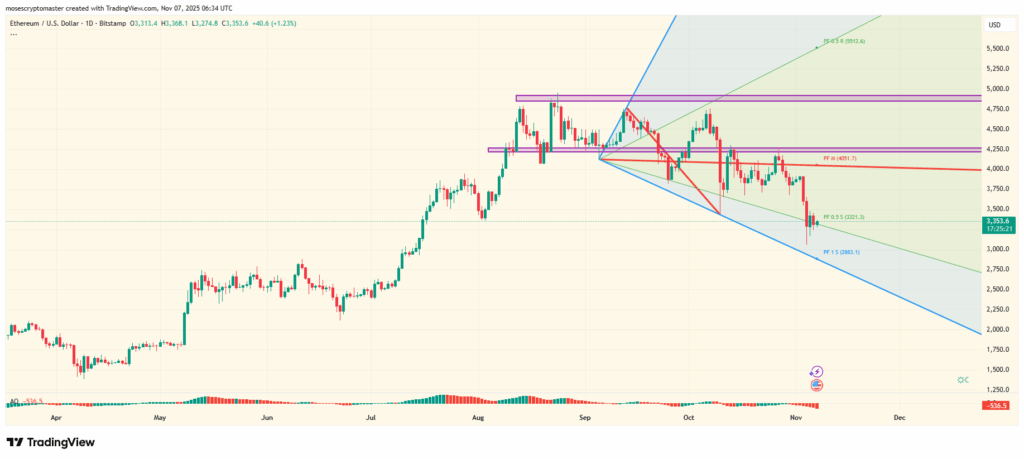
The mid-curve resistance at $4,051 (PF M) marked the zone that bulls must reclaim to break the pattern. Immediate support sat near the PF 0.5 level at $3,231, tested repeatedly this week.
Momentum remained weak. The histogram printed negative values as selling pressure persisted. The structure positioned the Ethereum price between whale-driven selling and retail-driven optimism.
The recent Tornado Cash outflow was not the only elephant in the room. The wider market narrative still depended on whether ETH can decouple from Bitcoin’s broader pullback.
Crowd Bullish, Whales Selling: Sentiment Split Widens
The sentiment flip highlighted by Santiment contrasted sharply with whale behavior. Historically, bullish crowd sentiment during downtrends coincided with further corrections.
IncomeSharks’ OBV argument supported that possibility. “Until there’s a clear reversal or we go back to breaking resistance, it’s best to stay out,” he wrote.
Yet buyers like AltcoinGordon dismissed that view entirely. “Few are ready for what happens next,” he said, implying trapped bears would fuel the next move higher.
The divide leaves the Ethereum price without a clear consensus signal. Bears controlled structure. Bulls controlled the narrative.
What Happens Next for Ethereum Price?
If ETH reclaims $3,500, the next test is at $3,800, followed by $4,050. A clean break above that level restores the uptrend and invalidates the descending channel.
Failure to hold $3,231 opens the path toward $2,880, with deeper capitulation possible if Bitcoin weakens further.
Three forces are competing: whale exits, retail bullishness, and a technical downtrend structure. Only one will decide the next directional move.