
 Puffer
 ZKsync
 Bitcoin
 NEAR Protocol
 Pearl
Pearl Quantus
 Sui
Sui

ZEC price has recovered above $600 after a massive 1,200% rally earlier in the month. A massive whale position with positive technical patterns suggests renewed upside potential if key support levels are maintained. Traders are now watching to see if the momentum can reach the $750 resistance level in the short term.
Whale Makes $12M Long Exposure on ZEC Price
Blockchain tracker Lookonchain unveiled that a whale opened a $12 million long position on ZEC. The investor deposited 6.27 million USDC in Hyperliquid and placed a limit long order at $ 509.50, which was filled within a matter of hours. The order accumulated 20,833 ZEC, resulting in an unrealized profit of more than $1.4 million.
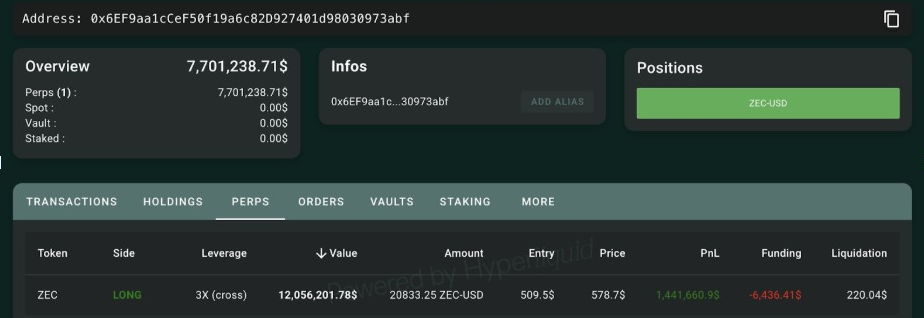
Moreover, the whale’s liquidation level is close to $220, indicating confidence in ZEC’s medium-term resilience. Funding costs of approximately $6,400 indicate a calculated plan to sustain the trade through volatility. Such high-capital entries are often institutional accumulation plays, according to analysts, especially after long rallies.
Although ZEC corrected sharply from its $750 high, this accumulation adds to bullish conviction. Market watchers say that maintaining the price action above $540-$560 could confirm the next leg upward. Hence, this range has been the short-term basis for the ongoing bullish structure.
ZEC Price Holds Strength After Major Rally
Additionally, after making a steep advance, ZEC price leveled off around the $520-$540 area. Buyers are buying up to maintain the selling pressure and keep the uptrend structure intact. This consolidation phase looks healthy and could be followed by another move higher if there is volume to support it.
Analyst JeremyBTC stated that the retracement represents a normal reaction to a long, parabolic climb. His chart shows the $520 zone as a Fibonacci retracement level that coincides with previous accumulation levels. If ZEC can maintain this range, the price may later return to $750, its recent high.
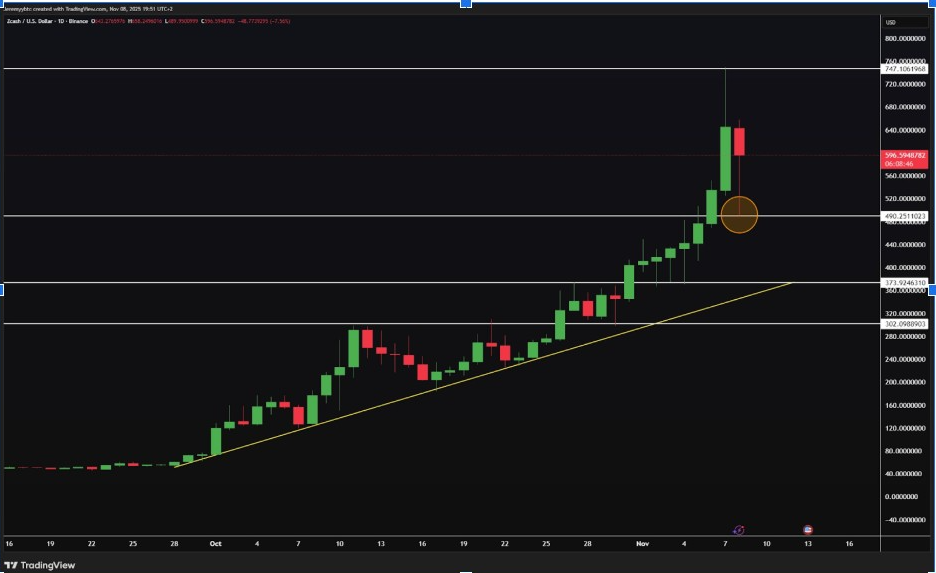
ZECUSD 1D Chart | Source: JeremyBTC, X
He added that the market volume is stable, with renewed confidence among buyers. “This correction is being eaten fast,” he said, pointing to strong bids on lower timeframes. Historically, similar pullbacks have often been followed by fresh rallies once the consolidation process has been completed.
Early Entry Pays Off as Traders Turn Cautious
Furthermore, analysts caution that ZEC’s heavy volatility may persist. Crypto Patel said that traders who purchased close to $700-$750 lost more than 30% in a single day. By comparison, his early entry at nearly $20 produced a 3,600% gain, demonstrating the power of accumulation.
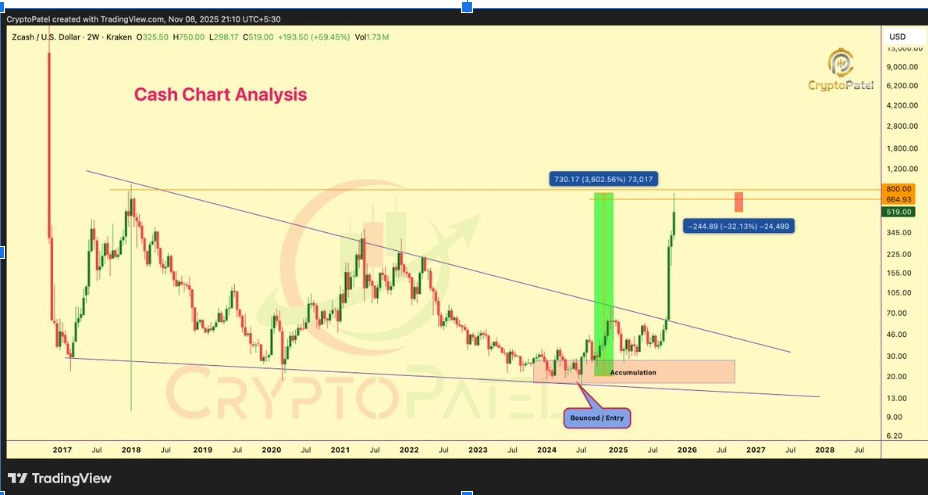
Patel’s multi-year format indicated a breakout from a descending resistance trendline that had been in place since 2018. ZEC then passed through significant barriers at $200 and $350, confirming the presence of a long-term reversal structure. Patel explained that smart accumulation during quiet phases delivers superior returns in major bullish cycles.
However, he cautioned against chasing rallies after such exponential moves. His analysis showed the $450-$520 area as a reaccumulation area for long-term positioning. Despite short-term volatility, he maintained that the long-term bullish pattern remains valid above this support range.
Key Levels Define Near-Term Scenarios
The ZEC price is trading in a range between $540 and $640, indicating a tight consolidation. This structure followed a reclaim of the $600 resistance and is now a short-term support zone. The level’s defense could decide whether or not the bulls can regain momentum towards previous bull run highs.
Analyst Lennaert Snyder noted that the setup displays “beautiful price action” after the security reclaims support. He said a loss of $540 would expose ZEC to $350, where major consolidation occurred before the last breakout. Snyder stressed that it is this level that carries liquidity, which provides a possible reversal point.
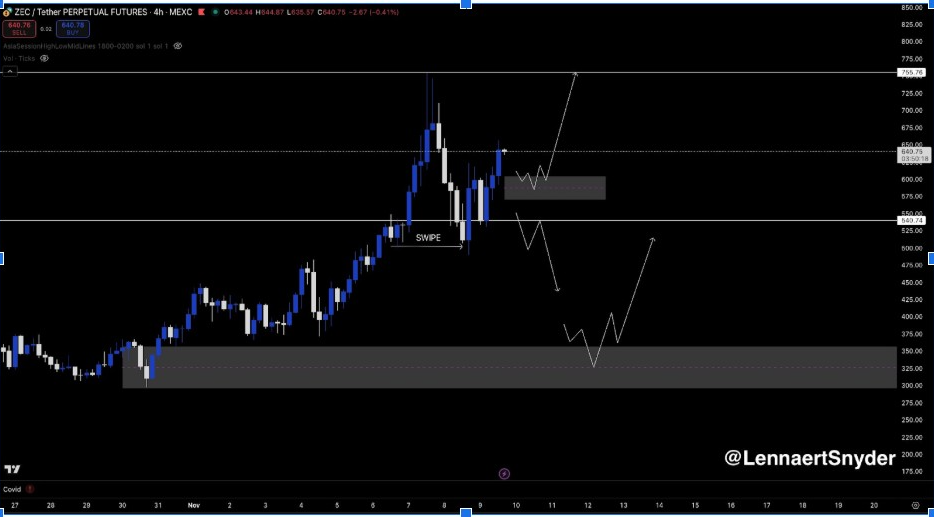
In a bullish scenario, holding above $600 could lead to a rally to $755-$760. Snyder added that preserving this base would ensure a larger bullish story. However, if the level breaks the $350 region, it is the strongest demand zone.
The $540-$600 corridor is now the control zone of the market. Sustaining strength here could confirm a renewed uptrend through late November. Traders will closely monitor this area for breakout confirmation or additional signals indicating a correction.


