NEAR Protocol
 Bitcoin
 Puffer
 Hyperliquid
 ZKsync
 Pudgy Penguins
 Pearl
Pearl

An altcoin season could be on the horizon as they test a four-year support zone against Bitcoin. Key market indicators show early signs of renewed strength. Analysts argue that this level has historically preceded major rallies, rather than ending bull cycles.
Altcoins Season Ahead? BTC Pair Returns to Multi-Year Support
Looking at the altcoins/BTC monthly pair, we see that the ratio currently trades near 0.12. The latest candle is showing a gain of about 7%.
We observe a long horizontal support band spanning the 2018–2020 consolidation lows and the current structure. In both 2017 and 2020, altcoins had already completed deep corrections versus Bitcoin before pivoting higher.
In the first cycle, the Altcoins/BTC pair was based around this band for roughly five bars. This is equivalent to about 151 days, before capital rotated aggressively into altcoins during 2017’s final quarter.
The ratio then advanced toward the 0.5 region. The move marked the peak of the previous cycle in altcoin outperformance.
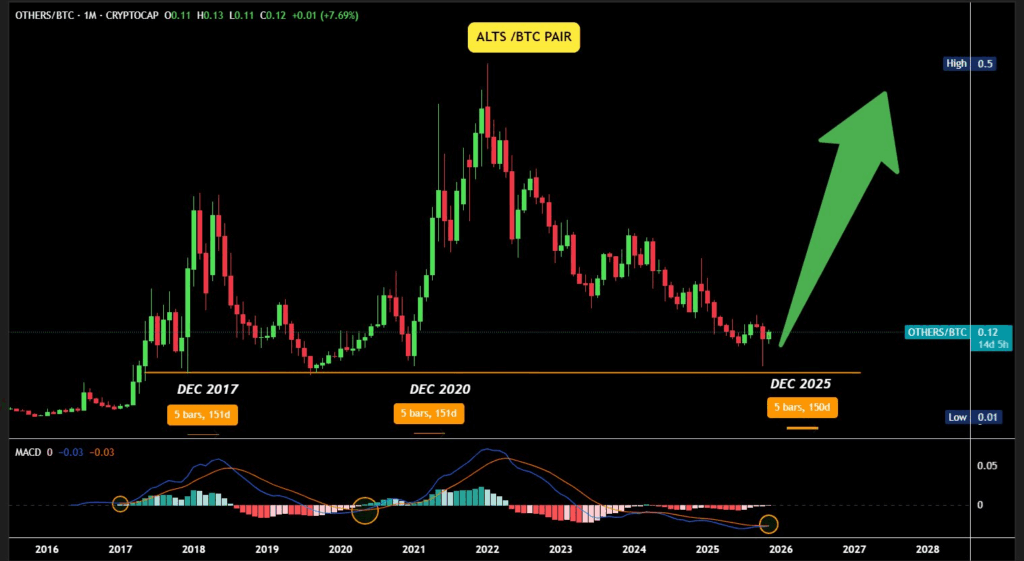
A similar pattern unfolded around December 2020. After spending another five bars on the same support, the Altcoins/BTC line broke higher again. That move coincided with the 2020–2021 altcoin cycle. The cycle had seen large caps and smaller tokens outpace Bitcoin for several months.
The current structure shows the ratio once more resting on this historical base. Price action since 2022 has formed a steady series of lower highs. It compressed into the same zone that marked the start of the last two altcoin advances.
Altcoin Season Cycles Point to Repeating Structure
Comparing charts from the 2020–2022 period with those from the ongoing 2024–2026 window, we see Bitcoin’s relative strength line trending sideways beneath a horizontal resistance band before breaking higher.
During 2020–2022, the altcoin season index remained subdued for months before spiking sharply as altcoins began to outperform. The 2024–2026 plot shows the indicator grinding along the lows and recently ticking upward from a base. Analyst describes it as the first meaningful bounce since 2021.
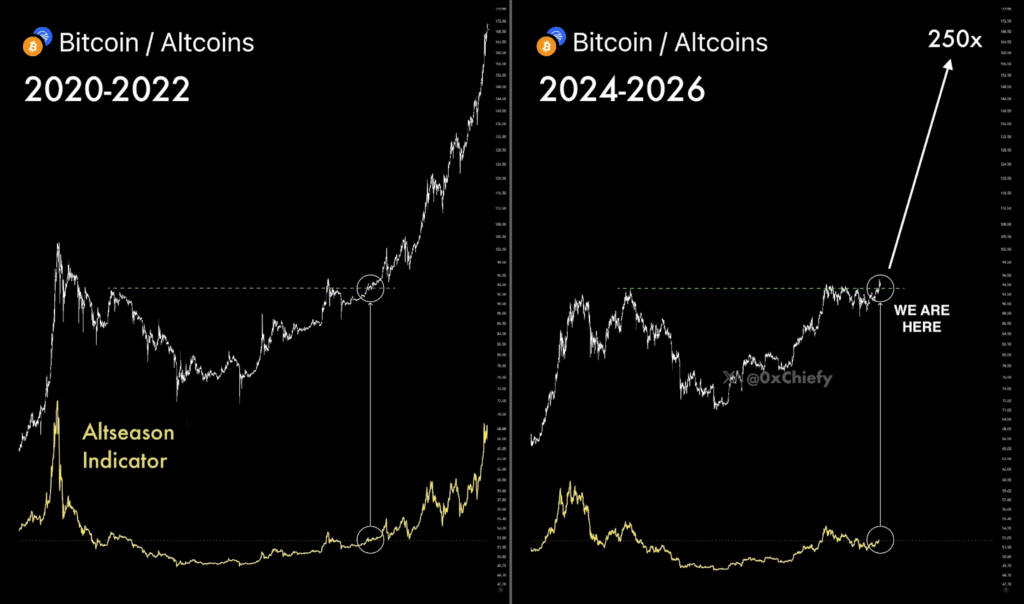
Looking at more data from 2015–2017 and 2019–2021, the sequence shows a pronounced bear phase, followed by an accumulation plateau and finally a steep uptrend. The current 2024–2026 strip has completed the bear block and sits in the accumulation segment.
Small candles have been clustered sideways at this point. The “Altseason” box remains outlined but still largely empty, indicating that, by this framework, the rotation phase has not yet fully unfolded.
Altcoin Season Index Hints at Gradual Shift
The CoinMarketCap Altcoin Season Index reads 31 out of 100. The figures place the market in what can be classified as a “Bitcoin Season,” instead of an altcoin season.
However, the progression of values over recent weeks suggests a slow but steady rise. The altcoin season index stood at 28 a month ago and 30 the previous week, before rising again to 31.
Historical extremes underscore the early nature of the current reading in relation to prior peaks.
Over the past year, the altcoin season index reached a high of 87 in early December 2024, firmly inside the altcoin season zone. It also set a low of 12 in late April 2025. That period saw Bitcoin outperform most other assets significantly.
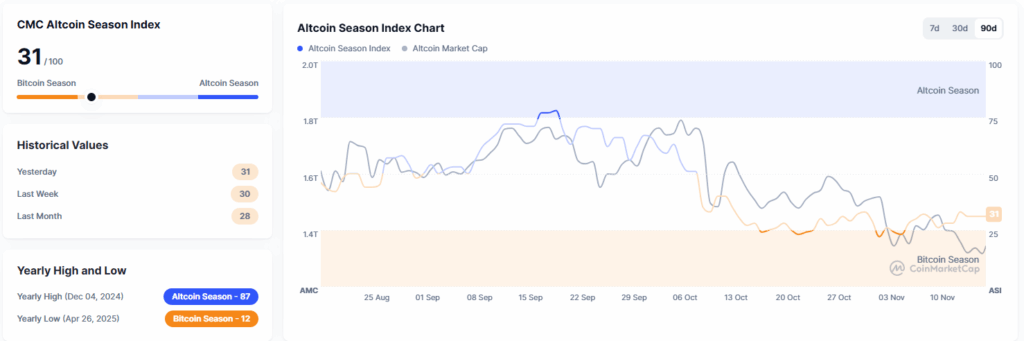
The 90-day chart shows altcoin market capitalization (in grey) fluctuating within a broad range. The altcoin season index line oscillates between the mid-20s and mid-40s.
Bitcoin’s dominance metric, plotted in orange, has edged higher during several stretches. However, it has not reclaimed the extremes seen at the April low in the index.
This data positions the present reading as transitional. Altcoins still lag behind Bitcoin on many time frames. However, the altcoin season index no longer sits at maximum Bitcoin dominance. It aligns with the analyst’s argument that “altseason indicator just bounced for the first time since 2021.”