Pearl
Pearl Walrus
 Bitway
 Bitcoin
 Quantus
 Quant
Quant Pudgy Penguins

Key Insights
- Dogecoin price stabilizes at crucial multi-month support near the $0.16 area.
- Volatility drops sharply, signaling compression after months of steady declines.
- Descending channel holds, keeping DOGE confined to a narrowing price structure.
The Dogecoin price is challenging multi-month support between $0.15 and $0.16. The index has buffered falls in 2024 and 2025. The latest retest comes as market volatility reaches its lowest point in three months. This is an indicator of the tightening stage, where the price movement is getting tighter and tighter.
On-chain data shows new activity by large holders and citing a quote by BitOrigin stating that the company is stacking $500 million of DOGE.
Dogecoin Price Stabilizes at Multi-Month Support as Downside Slows
Charts indicate that the Dogecoin price is stabilizing above the $0.15-$0.16 demand zone. The zone served as a launchpad for rebounds in mid-April, late May, and early August. All past tests have seen recoveries in the mid-range of $0.20 to $0.22.
The current retest resumed when the DOGE price rejected $0.26 resistance level at the beginning of October. The trend has since established a progression of relatively lower highs on October 10, October 20, and November 5. The movements have marked the continuation of a downward trend towards the depths of the wider trend architecture. The latest candles at and below $0.161 portray longer wicks. The wicks suggest that directional force is slowing down as DOGE sits right on the same mark several times this year that has brought in buyers.
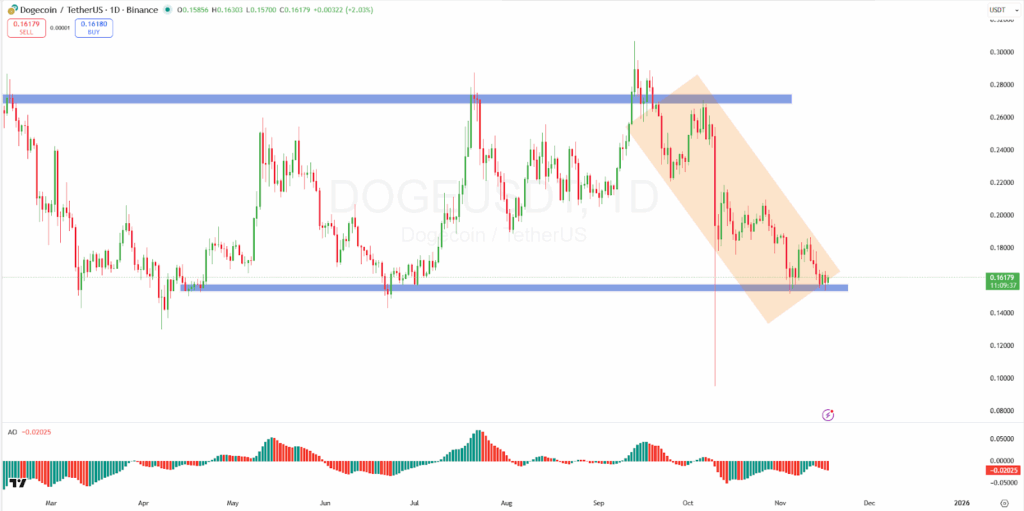
The Awesome Oscillator on the daily timeframe still displays the red bars. However, the decreasing depth of the histogram indicates that there is no longer an acceleration of momentum downwards.
The difference between the previous periods of August and October, when the negative bars prevailed is a highlight of the extent of the selling urge that has been dampened down. This new squeeze is in line with the stretched stalemate at the support. This is particularly because the volume on a day-to-day basis is no longer following the spikes noted in the summer rallies.
Dogecoin has been in a downward-trending channel since the beginning of October and has remained within this channel. The top of the channel corresponds well with the larger zone of resistance at $0.24-$0.26. The zone has repelled upward movements in July, August, and the first week of October.
Historical Volatility Hits the Lowest Reading Since August
Dogecoin’s 30-day annualized volatility has fallen from levels near 1.5 in late September to roughly 0.8 in mid-November. This fall marks the lowest reading in the last three months. The volatility curve indicates a continuous decrease in October and November. The dogecoin price lost the $0.20 to 0.22 band status to the present price of $0.16. Such a reduction in volatility in a downtrend depicts a significant shift in market tone.
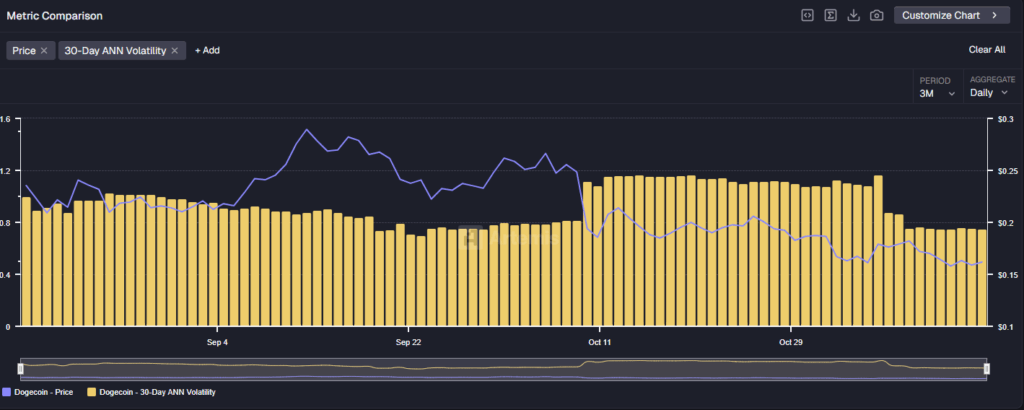
The previous sell-offs in the months before August and September were characterized by spikes in volatility. On the other hand, the most recent period is characterized by a distinct dissociation between declining prices and the volatility level. This means moderate conditions on both sides of the market.
The low volatility correlates with the DOGE price flattening in the lower time window of the volatility chart. Dogecoin spent most of September in a range of between $0.20 and $0.22. The meme coin then began to squeeze into the range of $0.16 in October and early November. The reduction in volatility over the given period implies that there was a low level of aggressiveness by both buyers and sellers. This factor also led to the stabilization in the daily chart.