
 Pearl
Pearl Bitway
 Sui
Sui Pons
Pons Starknet
 Quantus
 Bitcoin

Dogecoin price prediction has turned more constructive as traders observe several bullish patterns forming at the same time. Charts from analysts show a falling wedge, a bullish RSI divergence, and a wide symmetrical triangle.
DOGE price structures around key support levels raise questions over whether the top meme coin is preparing for a new breakout.
Dogecoin Price Prediction: Falling Wedge Nears Breakout Zone
The Dogecoin price is currently trading inside a falling wedge on the higher time-frame chart. Two downward-sloping trendlines contain a series of lower highs and lower lows, shaping the pattern.
From the analysis, the meme coin price moved repeatedly between these boundaries, creating a narrowing channel as the lines converged. This compression is a zone where markets prepare for a shift in direction.
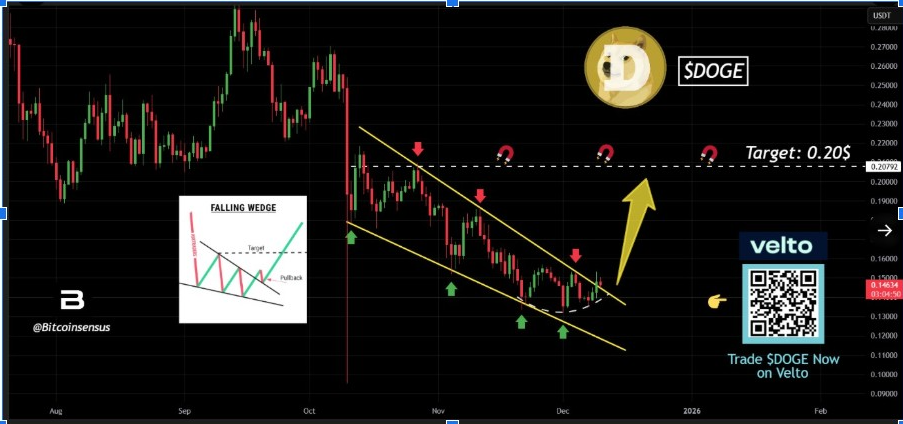
Recent candles near the lower trendline show less downside pressure than earlier in the move. Lows now curve into a rounded base instead of sharp spikes, which points to waning selling strength near support.
According to Bitcoinsensus, a break above the upper wedge boundary would be the first win for buyers in this structure. In that scenario, attention turns to a horizontal level around $0.20 as the next upside target for DOGE.
That band sits well above the current trading area and matches an earlier consolidation zone on the chart. On previous visits, the zone acted as a resistance. So, traders now treat it as a key checkpoint for this Dogecoin price prediction.
Momentum Signal: RSI Bullish Divergence Near Support
The wedge setup is closely linked to momentum readings on the four-hour chart, as monitored by Trader Tardigrade. While price recorded equal or slightly lower lows near support, the Relative Strength Index has formed higher lows over the same period.
Rising RSI troughs indicate that demand is slowly rebuilding, even as Dogecoin price trades near its recent floor. Momentum starts to improve while the price moves sideways to slightly lower levels, creating what technicians describe as a bullish divergence.
The indicator still sits below the 50 midpoint, so a strong uptrend is not yet visible on this time frame. Even so, the shift in slope between price and the RSI offers traders an early reference point for strengthening conditions.
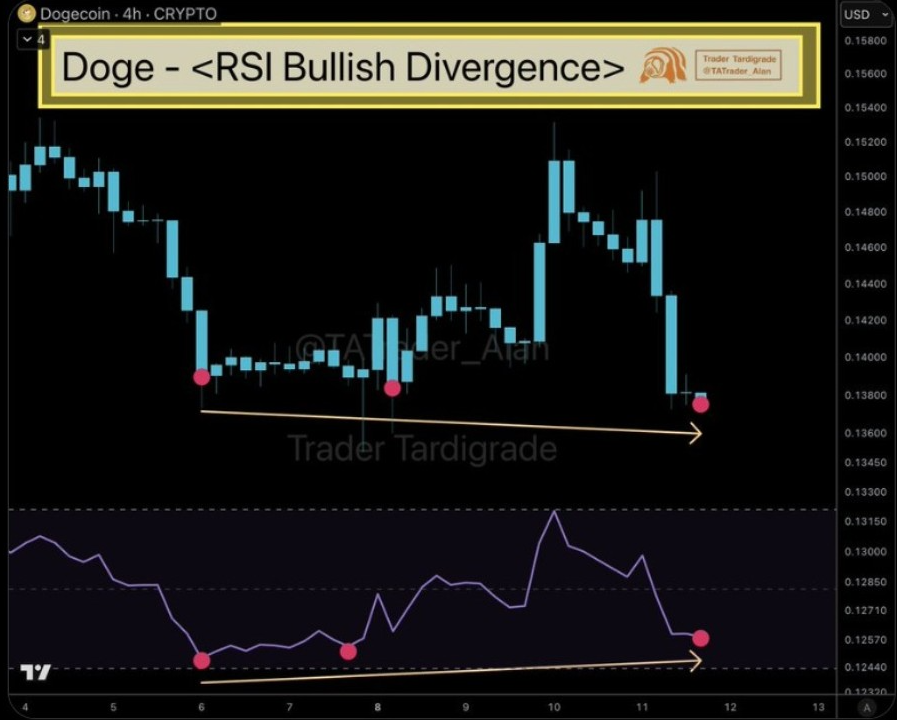
Bullish divergence appearing near the support area marked by Bitcoinsensus brings the two analyses together. If Dogecoin price holds this support and begins to push higher, the earlier RSI move is a bullish signal rather than a delayed reaction.
For many traders, that combination of structural support and rising momentum is central to the current Dogecoin price prediction.
Symmetrical Triangle Keeps $0.20 Target in Play
On the twelve-hour chart, Trader Tardigrade maps a broader symmetrical triangle that frames Dogecoin price recent trend. The upper trendline links a sequence of lower highs, while the lower trendline connects a chain of higher lows.
These converging lines create a contracting trading range where volatility gradually shrinks over time. DOGE recently retested the lower support line, adding another contact point and maintaining the triangle structure intact.
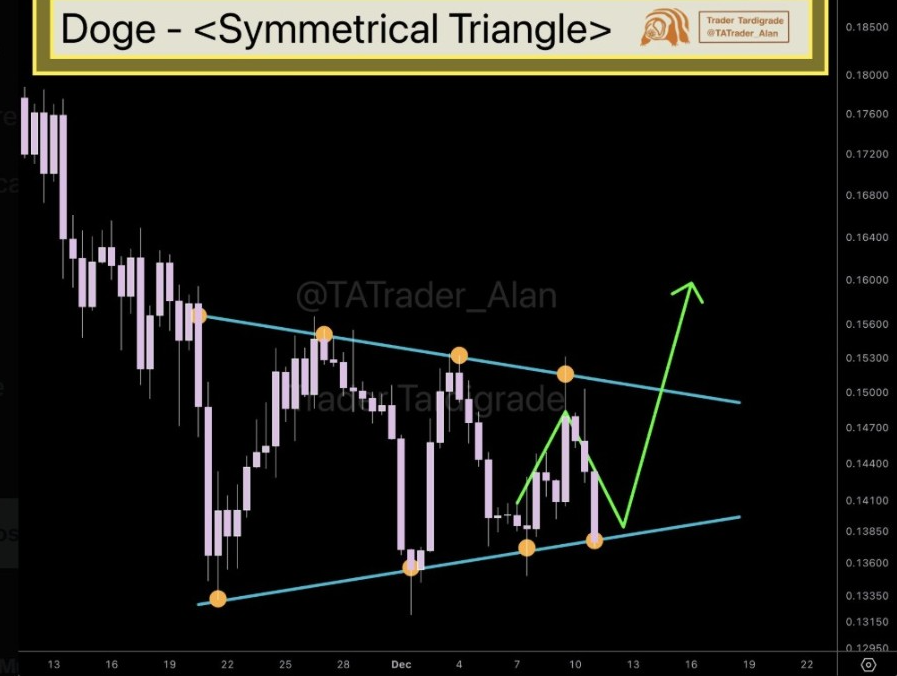
Within this range, DOGE price swings from support to resistance and back again as traders test both sides.
Currently, the primary technical focus is concentrated in three key areas. Analysts watch the upper wedge boundary, the triangle resistance line, and the $0.20 horizontal zone tied to previous trading activity.
A strong move above both trendlines, backed by rising volume, will shift market attention toward the target band. Consequently, this move will validate the current Dogecoin price prediction that leans on converging bullish structures.




