
 Pearl
Pearl Bitway
 Pudgy Penguins
 Optimism
 Walrus
 NEAR Protocol
 Pons
Pons

Dogecoin price is now trading near long-term demand as downside momentum fades. The technical structure implied stabilization, not acceleration, lower. Therefore, Dogecoin price prediction now relies on whether important support zones continue to hold.
Dogecoin Price Targets Key Long-Term Support Zones
Dogecoin price prediction is currently focusing on historically important support levels. A long-term chart by Ali Martinez highlighted $0.10 and $0.062 as demand areas. These levels were previously accumulation levels during prolonged bearish cycles.
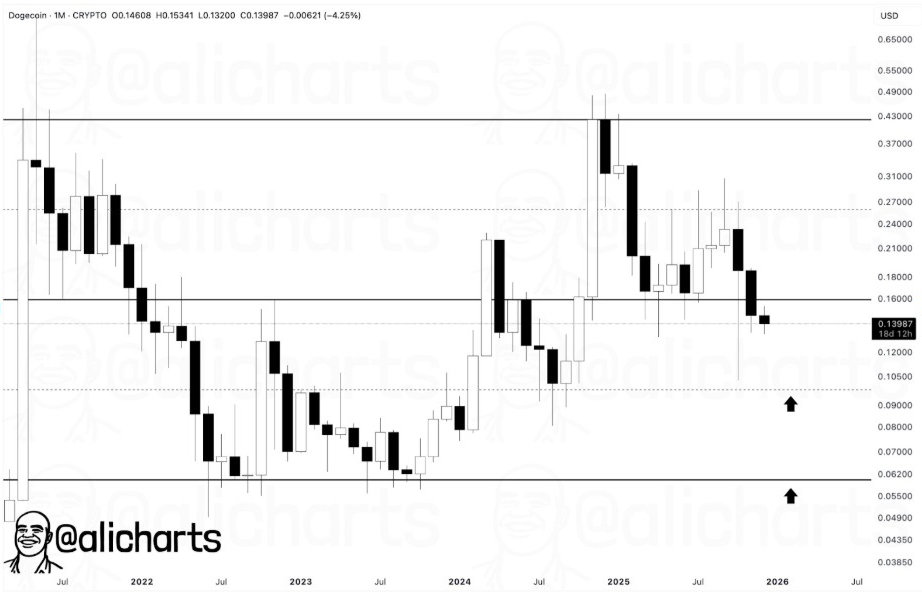
Importantly, price has approached these areas without a sharp capitulation. This behavior is often controlled selling rather than panic-driven selling. As a result, Dogecoin price prediction is skewed toward stabilization instead of breakdown.
Moreover, the DOGE price is still above its deepest historical base, which is close to $0.062. That zone served as the bottom of the cycle during previous downturns. Holding above it preserves the higher time frame structure.
However, sustained weakness under $0.10 would change the outlook. A decisive loss of that level could open deeper downside risk. According to DOGE price action, buyers are absorbing supply.
Historical Cycle Behavior Affects Medium-Term Expectations
A Dogecoin price prediction gains further context when viewed through historical cycles.
A trend analysis shared by Bitcoinsensus details DOGE’s tendency to move in exponential waves. Each major cycle had historically delivered stronger gains than the previous cycle.
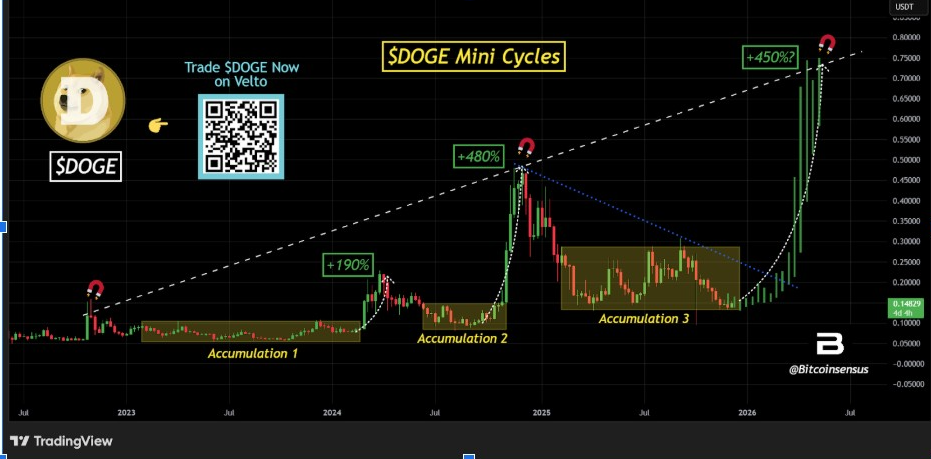
The first expansion resulted in a rally close to 190%. The second was followed by a much bigger move of around 480%. A potential third cycle implies a potential upside of 450% based on previous patterns.
Using this framework, the long-term projections indicate a potential level of $0.75. Such a move would be sustained accumulation and newfound momentum. Notably, previous rallies only appeared after prolonged periods of consolidation.
The current meme coin price action closely resembles those accumulation periods. The top meme coin keeps ranging rather than trending sharply in one direction. This behavior is consistent with setups before large upside moves in the past.
Short-Term Structure Indicates Seller Fatigue
Notably, Dogecoin price prediction is also finding support from the lower-timeframe structure. A four-hour chart posted by Trader Tardigrade showed a developing falling wedge. This pattern is often found near trend exhaustion points.
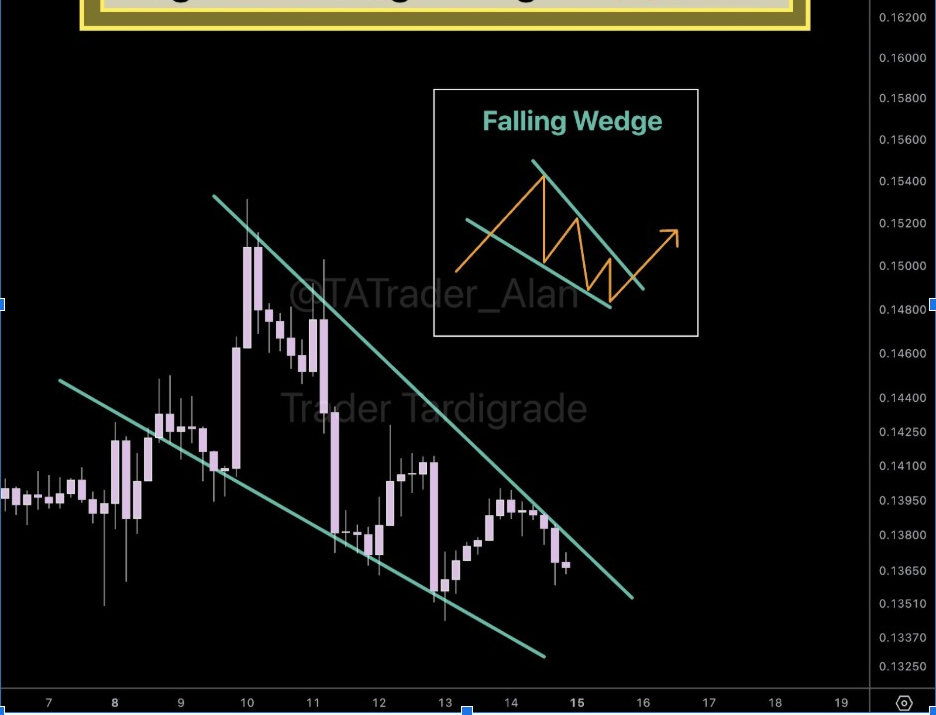
The wedge indicated lower highs compressing against the stable demand. Meanwhile, downside momentum breaks with each lower push. This structure is often indicative of seller fatigue, rather than strong bearish control.
Typically, falling wedges are followed by upside breakouts. However, confirmation needs a strong move above resistance. Until then, Dogecoin price prediction is cautiously constructive.
Short-term price action is also characterized by repeated defense of local support. Small rebounds are a sign of active buyer interest. Therefore, the possibility of a relief rally can exist if momentum improves.
Base Formation Developed Around Key Demand
Meanwhile, Dogecoin price prediction focused on the signals of base formation. A daily chart shared by BitGuru showed the DOGE price holding a defined demand zone. Price action suggests stabilization after a long downtrend.
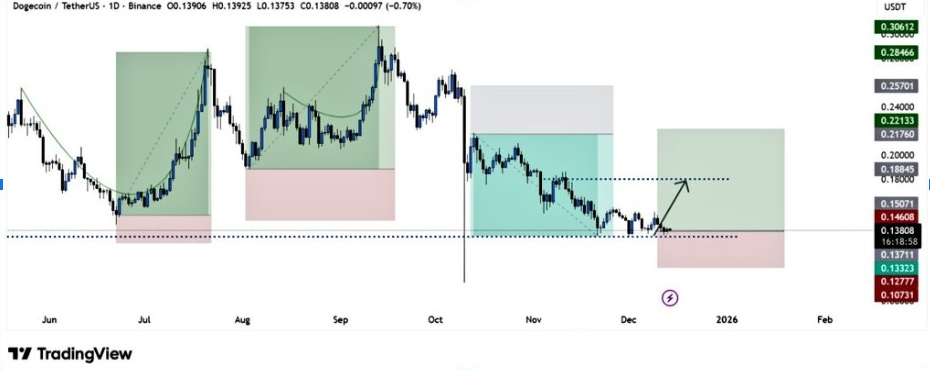
According to the analysis, maintaining support helps prevent bounce scenarios from arising. The next upside target is found near an area of strong resistance. This level aligns with previous reaction highs during consolidation phases.
Additionally, the structure is similar to the base formations during 2023. Those periods were characterized by low volatility, preceding directional resolution. The current conditions are indicative of the same compression phase.
Declining downside momentum is also supportive of the basing narrative. Lower volatility tends to precede directional expansion. As long as demand persists, the Dogecoin price prediction remains in the neutral to positive range.




