
 Pearl
Pearl Bitway
 NEAR Protocol
 Sui
Sui Pudgy Penguins
 Starknet
 Pons
Pons

In an unusual pump and dump, the Bitcoin price surged all the way to $90,000. Thereafter, it crashed once again to $86,000.
This led to a massive $140 billion swing for BTC, triggering both long and short liquidations. The latest developments have kept investors on the edge with hopes of a ‘Santa rally,’ declining.
Bitcoin Price Sees A Major Pump and Dump
In the last 24 hours, the Bitcoin price has experienced major volatility. It surged more than $3,000 within an hour to briefly reclaim the $90,000 level. This move led to a massive $120 million in liquidation of short positions.
However, the rally couldn’t sustain for long, and hours later, Bitcoin price saw a sharp drop o $86,000. This led to a liquidation of over $200 million in leveraged long positions. As a result of this rapid swing, Bitcoin’s market cap has registered a $140 billion swing.
Market observers noted that this massive back-to-back liquidations underscore the elevated level of leverage. On the other hand, Bitcoin’s on-chain activity is showing signs of cooling. The number of active Bitcoin addresses has dropped to its lowest level in more than a year.
This shows that fewer participants are transacting on the Bitcoin blockchain amid continuous price volatility. It also reflects weaker sentiment from both retail investors and short-term traders.
Analysts note that such reductions in active addresses are often associated with market slowdown phases.
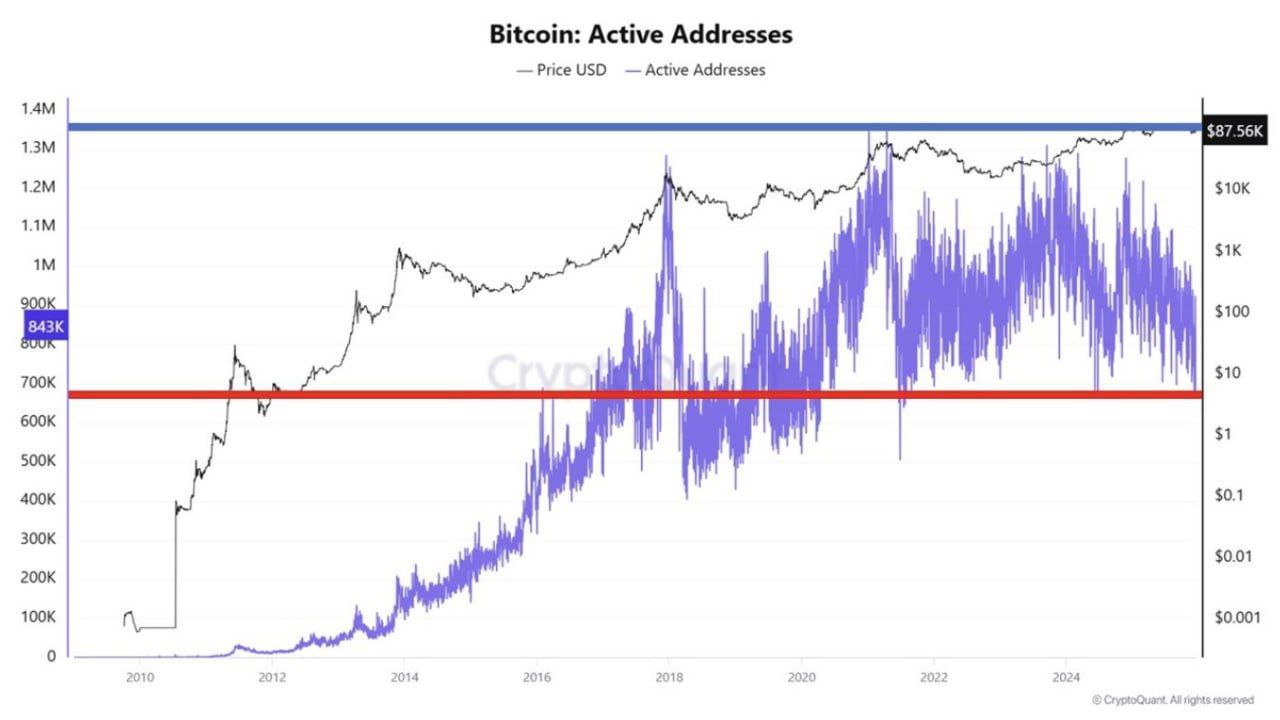
The above chart highlights a clear disconnect between Bitcoin price and the network usage. It shows that real transaction volume fails to match recent market moves.
Market observers warn that if subdued on-chain participation continues, tightening liquidity could lead to major volatility spikes.
Bitcoin Price Remains At Key Inflection Point
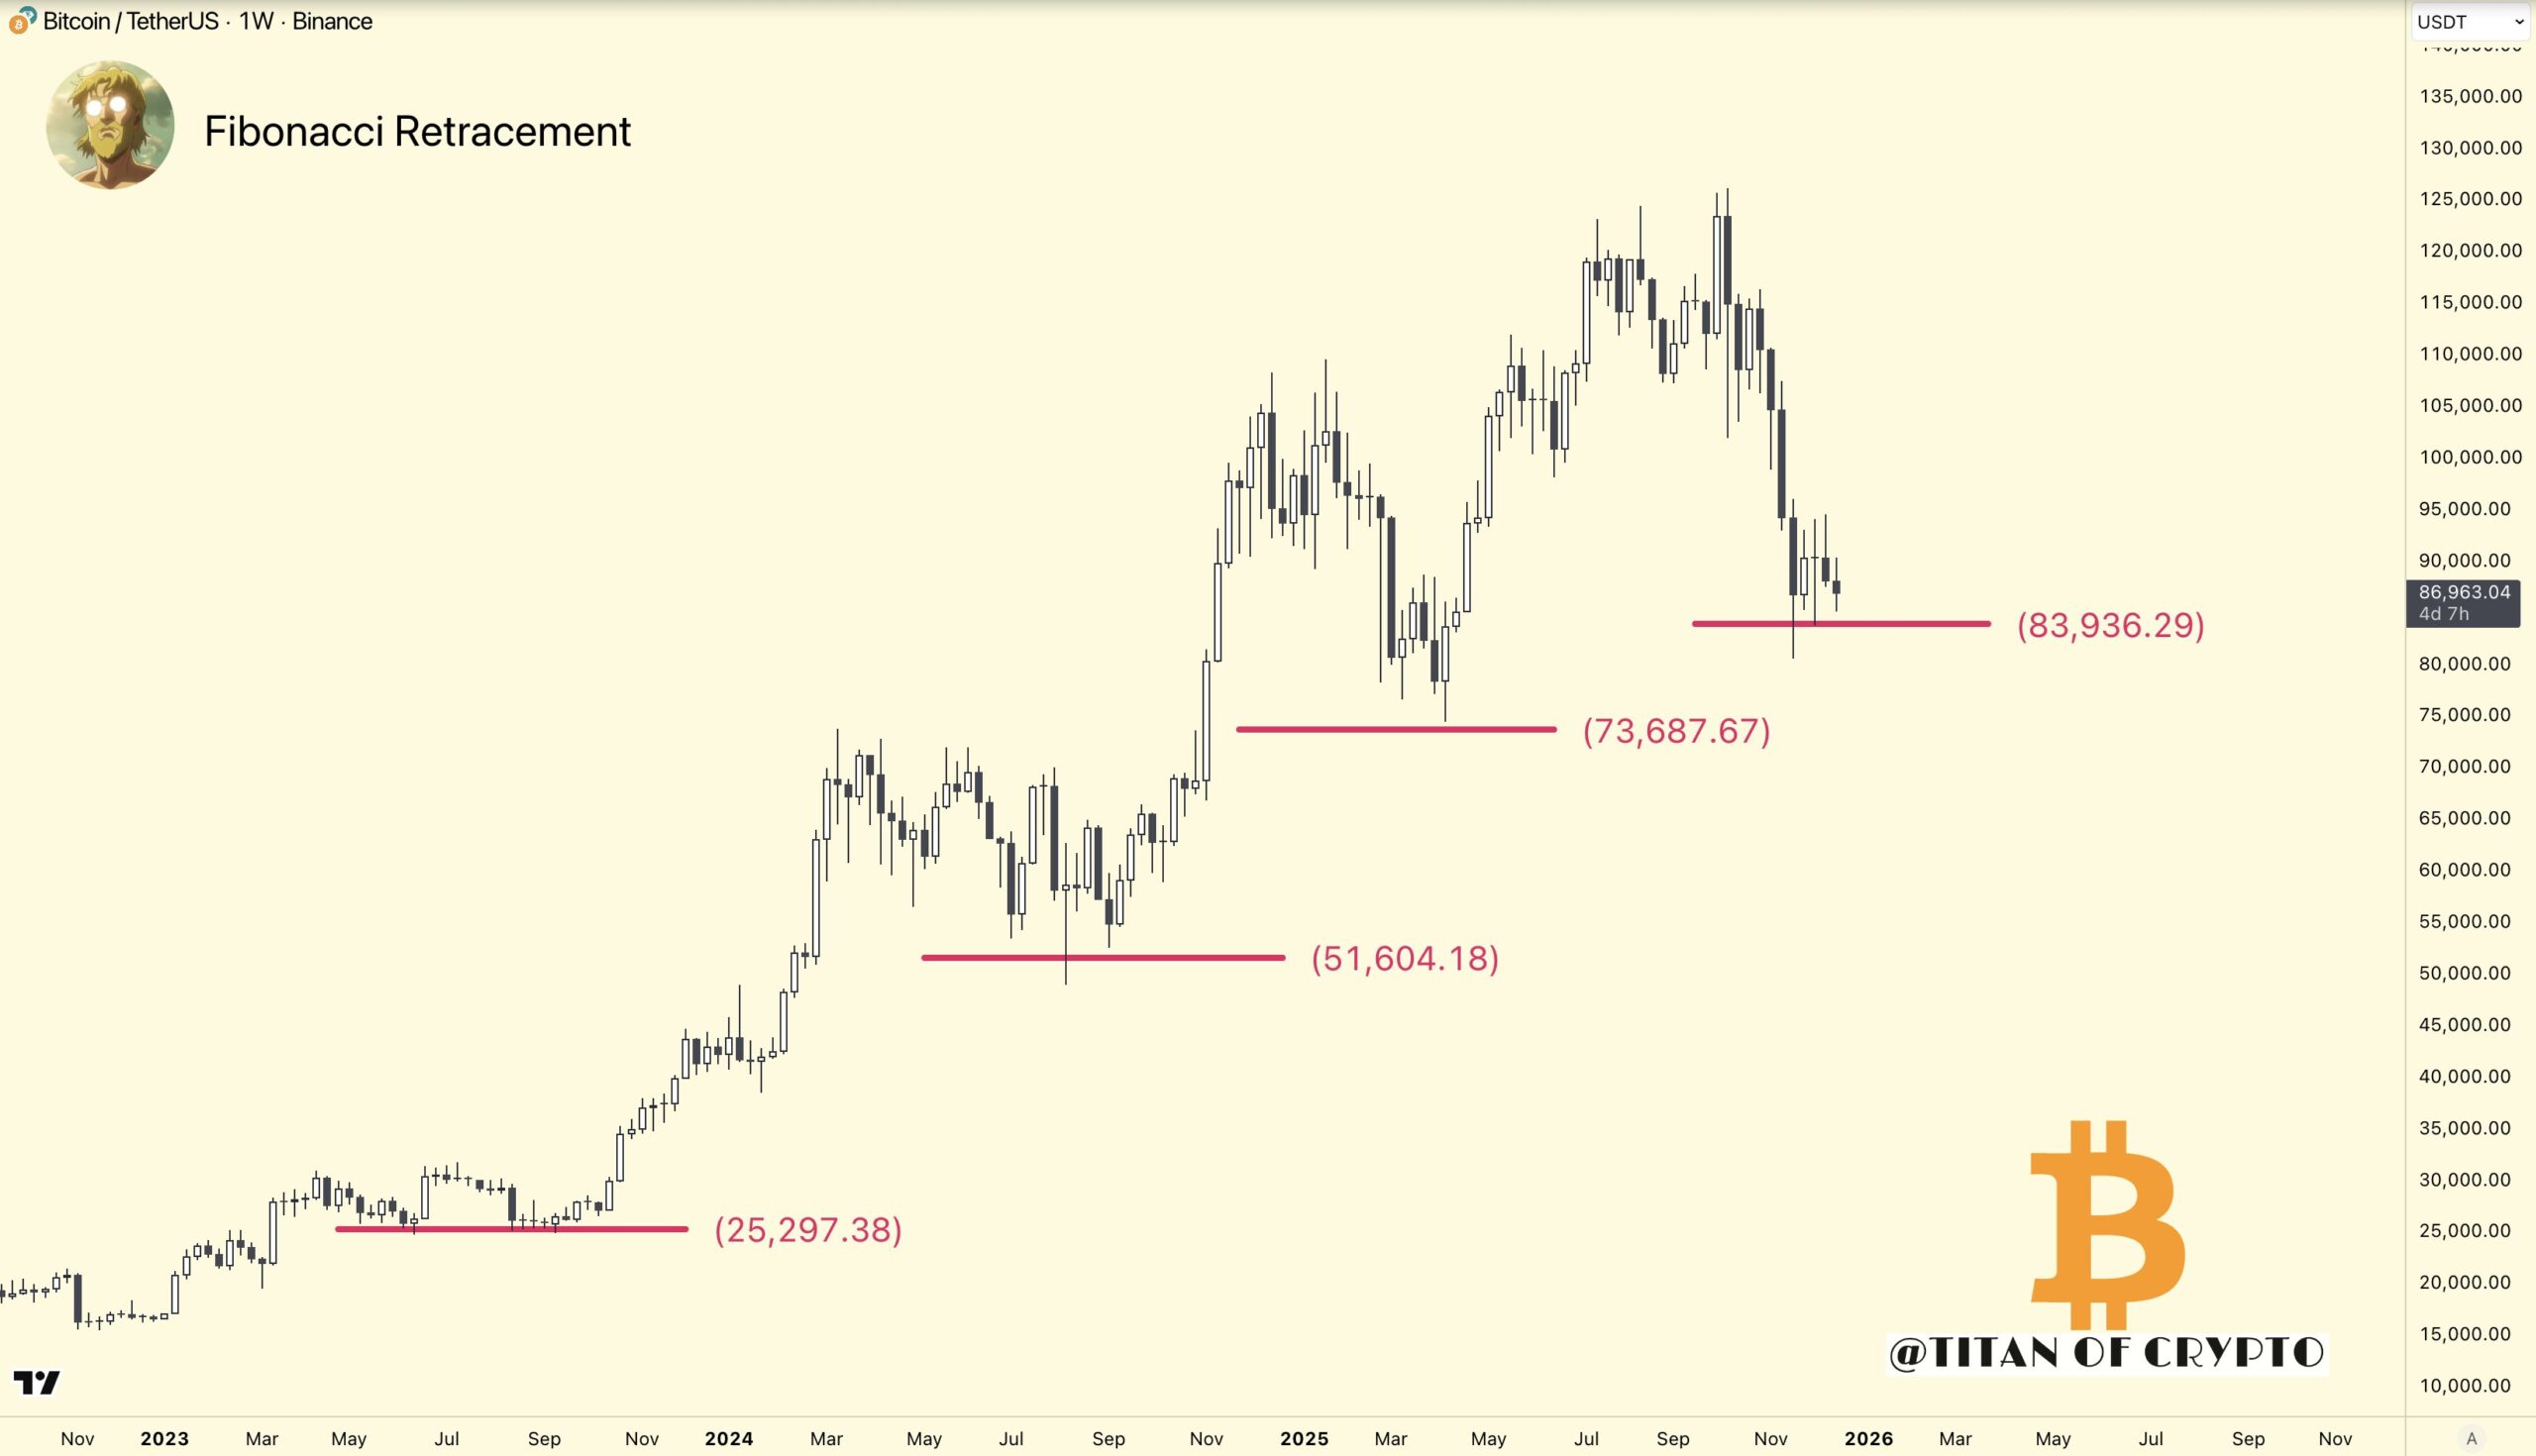
Bitcoin price is trading near a key technical inflection point, as per some market experts. Crypto analyst Titan of Crypto said Bitcoin’s recent rebound aligns with expectations. He noted that the price remains above the 38.2% Fibonacci retracement.
The analyst noted that as long as BTC holds $83,900 on the downside, things are not too bad. According to the analyst, holding this level preserves the possibility of further upside for bulls. However, breaking below it could lead to the start of the next bearish phase.
On the other hand, Santiment reported heightened short-term volatility after today’s Bitcoin price pump and dump.
They noted that rising positive funding rates across exchanges point to an increase in leveraged long positions. Such conditions usually lead to sharp liquidations and volatile price swings.
However, Santiment cautioned that the broader crypto market direction remains tied to Bitcoin. They said BTC funding rates must normalize or turn negative. They added that this shift would help support a move toward $100,000 and a wider altcoin recovery.
Bitcoin Flashes A Golden Cross Pattern Formation
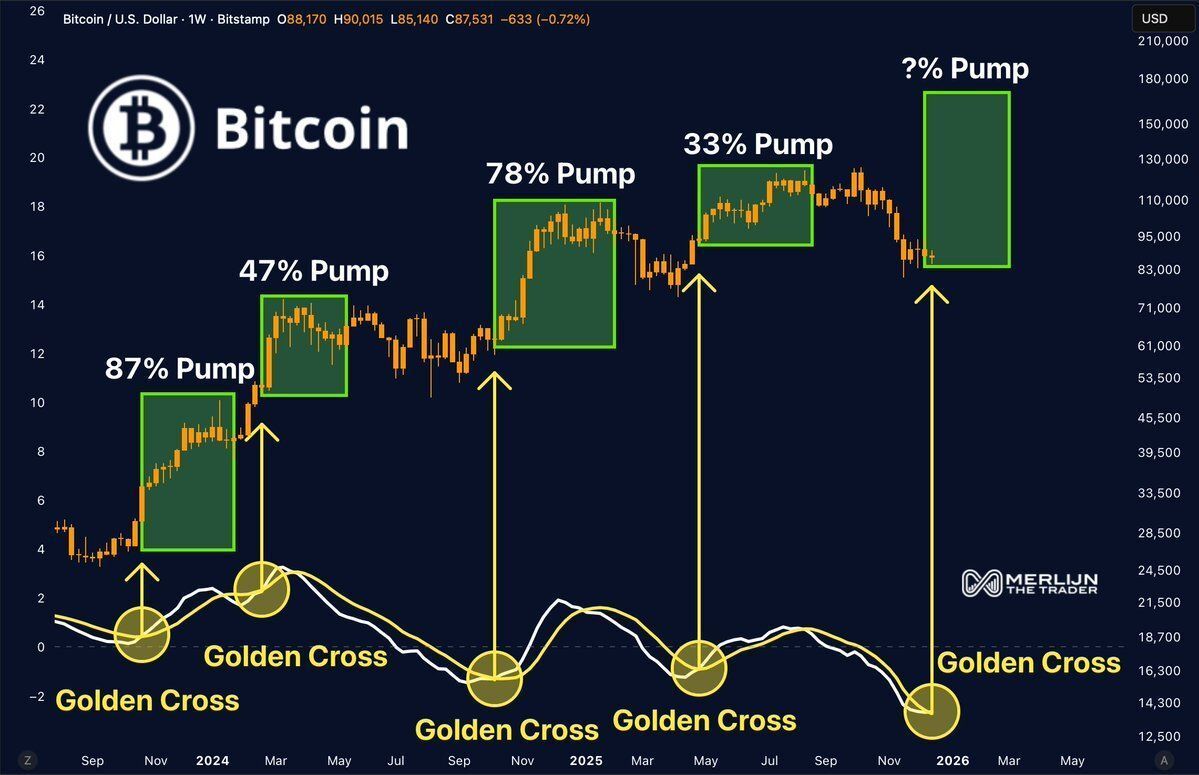
Bitcoin price has formed a new “golden cross.” He marked the fifth occurrence of the bullish technical signal.
A golden cross appears when a shorter-term moving average crosses above a longer-term moving average. This often leads to a potential trend reversal ahead.
Historical data shows that previous golden cross formations have led to notable BTC price rallies. During previous such instances, Bitcoin price saw gains of approximately 87%, 47%, 78%, and 33%.
Analysts say these signals usually appear during times of uncertainty and low confidence. They note that they often show up before broader market optimism returns.
However, investors should keep in mind that a golden cross does not guarantee immediate upside. On the other hand, ARK Invest CEO Cathie Wood suggested that Bitcoin’s traditional four-year market cycle may be losing relevance.
According to Wood, Bitcoin is once again behaving like a risk-on asset and “climbing a new wall of worry.” She noted that in previous cycles, Bitcoin routinely experienced drawdowns of 75% to 90%. However, recent price action indicates a decline in overall volatility.





