
 Pearl
Pearl Bitway
 Sui
Sui Pons
Pons Starknet
 Quantus
 Bitcoin

The XRP price has slumped by nearly 50% from its highest point this year. This decline may continue, as XRP has formed an alarming pattern on the weekly chart.
If this happens, it means that the multiple catalysts that occurred this year, such as ETF inflows and the outcome of the SEC vs. Ripple case, have backfired.
XRP Price Has Formed the Risky Double-Top Pattern
The weekly chart shows that the XRP price has slumped over the past few months. It dropped from its all-time high of $3.66 to the current $ 1.87.
XRP coin price has dropped below the 50% Fibonacci Retracement level at $1.9892 and the psychological level at $2. It also dropped below the 50-week Exponential Moving Average (EMA) and is now attempting to move below the 100-week average. This move will confirm the bearish outlook.
XRP crypto has dropped below the strong, pivot, reverse and the top of the trading range of the Murrey Math Lines tool at $2.3438 and $1.9530. Moving below these levels confirmed the token’s bearish outlook.
Most importantly, XRP has formed a double-top pattern at $3.3836 and is now approaching the neckline at $1.5893. A double top is one of the most popular bearish reversal patterns in technical analysis.
The Relative Strength Index (RSI) and the MACD indicators have continued to move downwards over the past few weeks. Therefore, the most likely scenario is where it continues falling, initially to the neckline at $1.5893. A drop below that level will indicate further fall to the psychological level at $1.
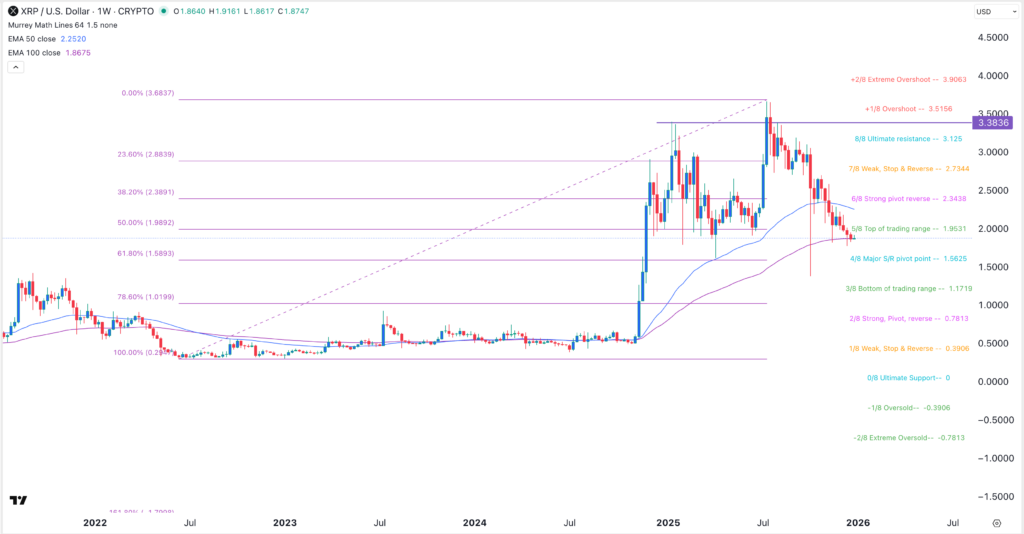
On the flip side, a rebound to the psychological level at $2.50 will invalidate the bearish XRP price prediction. It could increase the likelihood of the altcoin reaching its all-time high of $3.66 or higher.
Top Ripple Catalysts Have Backfired Amid the Crypto Market Crash
The bearish XRP price prediction is largely due to the ongoing crypto market crash, which has affected Bitcoin and most altcoins. It also means that its key catalysts, which occurred earlier this year, have not boosted the XRP performance.
One of these catalysts is that the Securities and Exchange Commission (SEC) approved the Canary, 21Shares, Bitwise, Grayscale, and Franklin Templeton XRP ETFs. These exchange-traded funds have become highly successful.
Before that, the agency approved the REX-Osprey XRP ETF, which was based on the Investment Company Act of 1940.
Data compiled by SoSoValue shows that the five XRP ETFs have experienced over $1.14 billion in inflows, with the net assets rising to $1.24 billion. It represents about 0.98% of the altcoin’s market capitalization.
These funds have never had a day of outflows. That’s noteworthy as spot Bitcoin ETFs have had over $1.08 billion in outflows this month and $3.48 billion in the previous month. Similarly, Ethereum ETFs have shed $602 million this month and $1.42 billion in the previous month.
XRP price has also dropped despite the recent success of Ripple USD (RLUSD), its highly successful stablecoin. Data compiled by CoinMarketCap shows that the stablecoin now has over $1.4 billion in assets. This figure will keep rising as it expands to other layer-2 networks, including Base and Optimism.
RLUSD is now the third-biggest GENIUS Act-compliant stablecoin after Circle’s USDC and PayPal’s PYUSD, which have $76 billion and $3.7 billion in assets, respectively.
Ripple also had other important catalysts this year that are not reflected in its price. For example, the SEC vs Ripple case ended earlier this year as Donald Trump fulfilled his campaign promise related to the crypto industry.
The other major catalyst came from the Office of the Comptroller of the Currency (OCC), which gave Ripple Labs a provisional national banking charter. The company will now be able to offer banking solutions, such as custody, to its clients.
The other top XRP catalysts were the recent investment by Citadel and Fortress, valued at over $40 billion, and the launch of CME XRP futures.




