
 Bitcoin
 Ondo
Ondo NEAR Protocol
 Walrus
 Pearl
Pearl Pons
Pons Ethereum

Dogecoin price rebounded strongly as one of the hardest‑rising memecoins on the charts. Yet smaller, less‑capitalized tokens outperformed it. Most of the indicators were in support of a further uptrend on top of massive accumulation for the memecoin.
With a 12% spike in price action on the day, the memecoin could be carving a path for the broader sector. However, the question remains if this will be sustainable in the first quarter of the year.
What Does Dogecoin MACD Histogram Say?
Trader Tardigrade noted on the daily chart that Dogecoin price showed a possible MACD histogram shift. This signaled a potential change in momentum.
Its price had been going down from highs of about $0.2400 in October to lows of about $0.1000. Recent closes have been around $0.1400, which broke a descending trendline.
However, the histogram presented a distinct picture. The negative red bars went from -0.02000 to almost zero. At the same time, the positive green bars grew from zero to around +0.01000. This trend showed that the upward momentum was getting stronger.
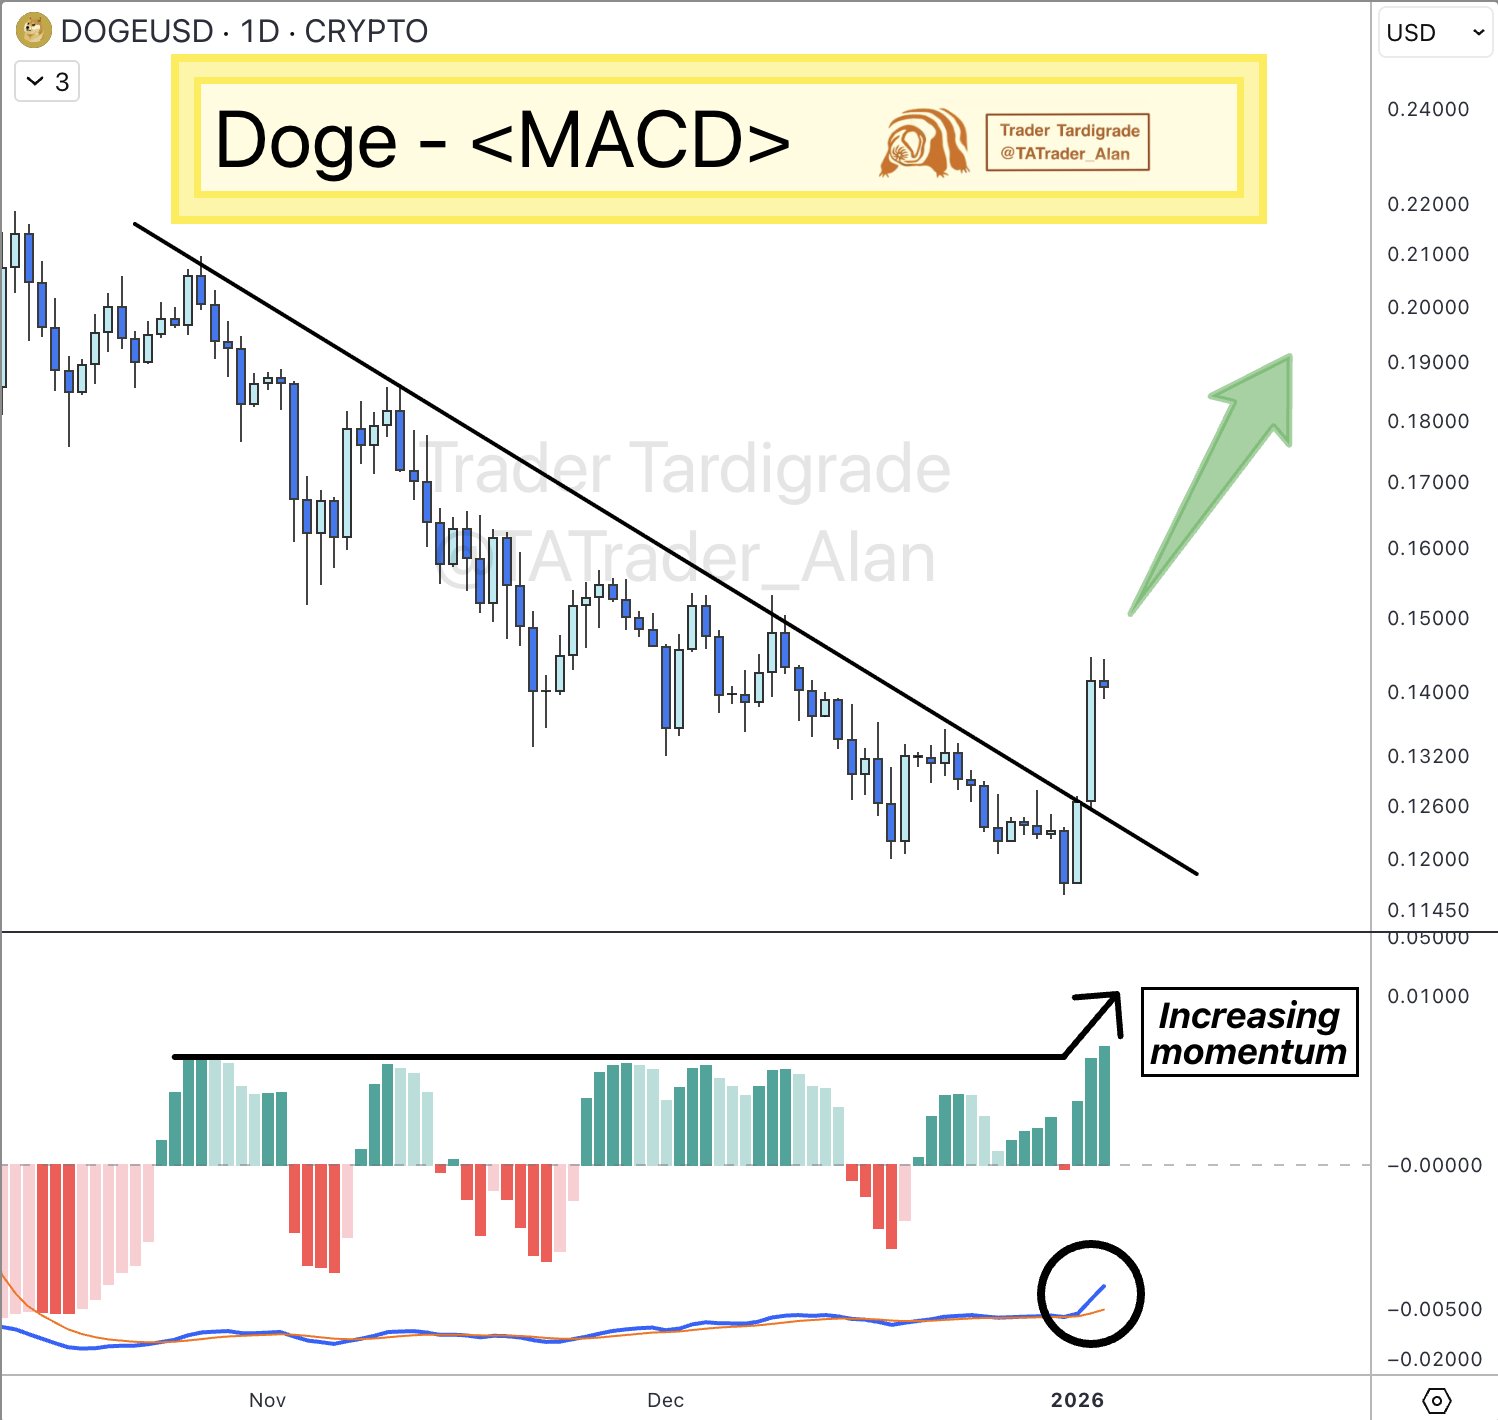
This setup pointed to a bullish divergence. This divergence indicated a potential weakening of bearish pressure before a market turnaround. The price stabilized and stayed above $0.1200 after the breakout.
The MACD line crossover could start a rally toward $0.2000. Conversely, if it doesn’t hold, the price could drop to $0.0800, depending on how the rest of the market reacts. As of press time, traders were still split, with a focus on managing risk.
Dogecoin Price Surges After Accumulation: What’s Next?
Again, as shown in its long-term channel chart, the Dogecoin price rose 12%. This was after bouncing back from a key Cumulative Value Days Destroyed (CVDD) accumulation zone.
The price had dropped to about $0.10 in late 2025 and then rose to about $0.14 by early 2026. DOGE price interacted with lower CVDD multipliers like x1.618 and x1.5. The higher CVDD, like x11, reached $0.50+.
This reaction was consistent with DOGE’s past behavior of building up at CVDD supports before rising.
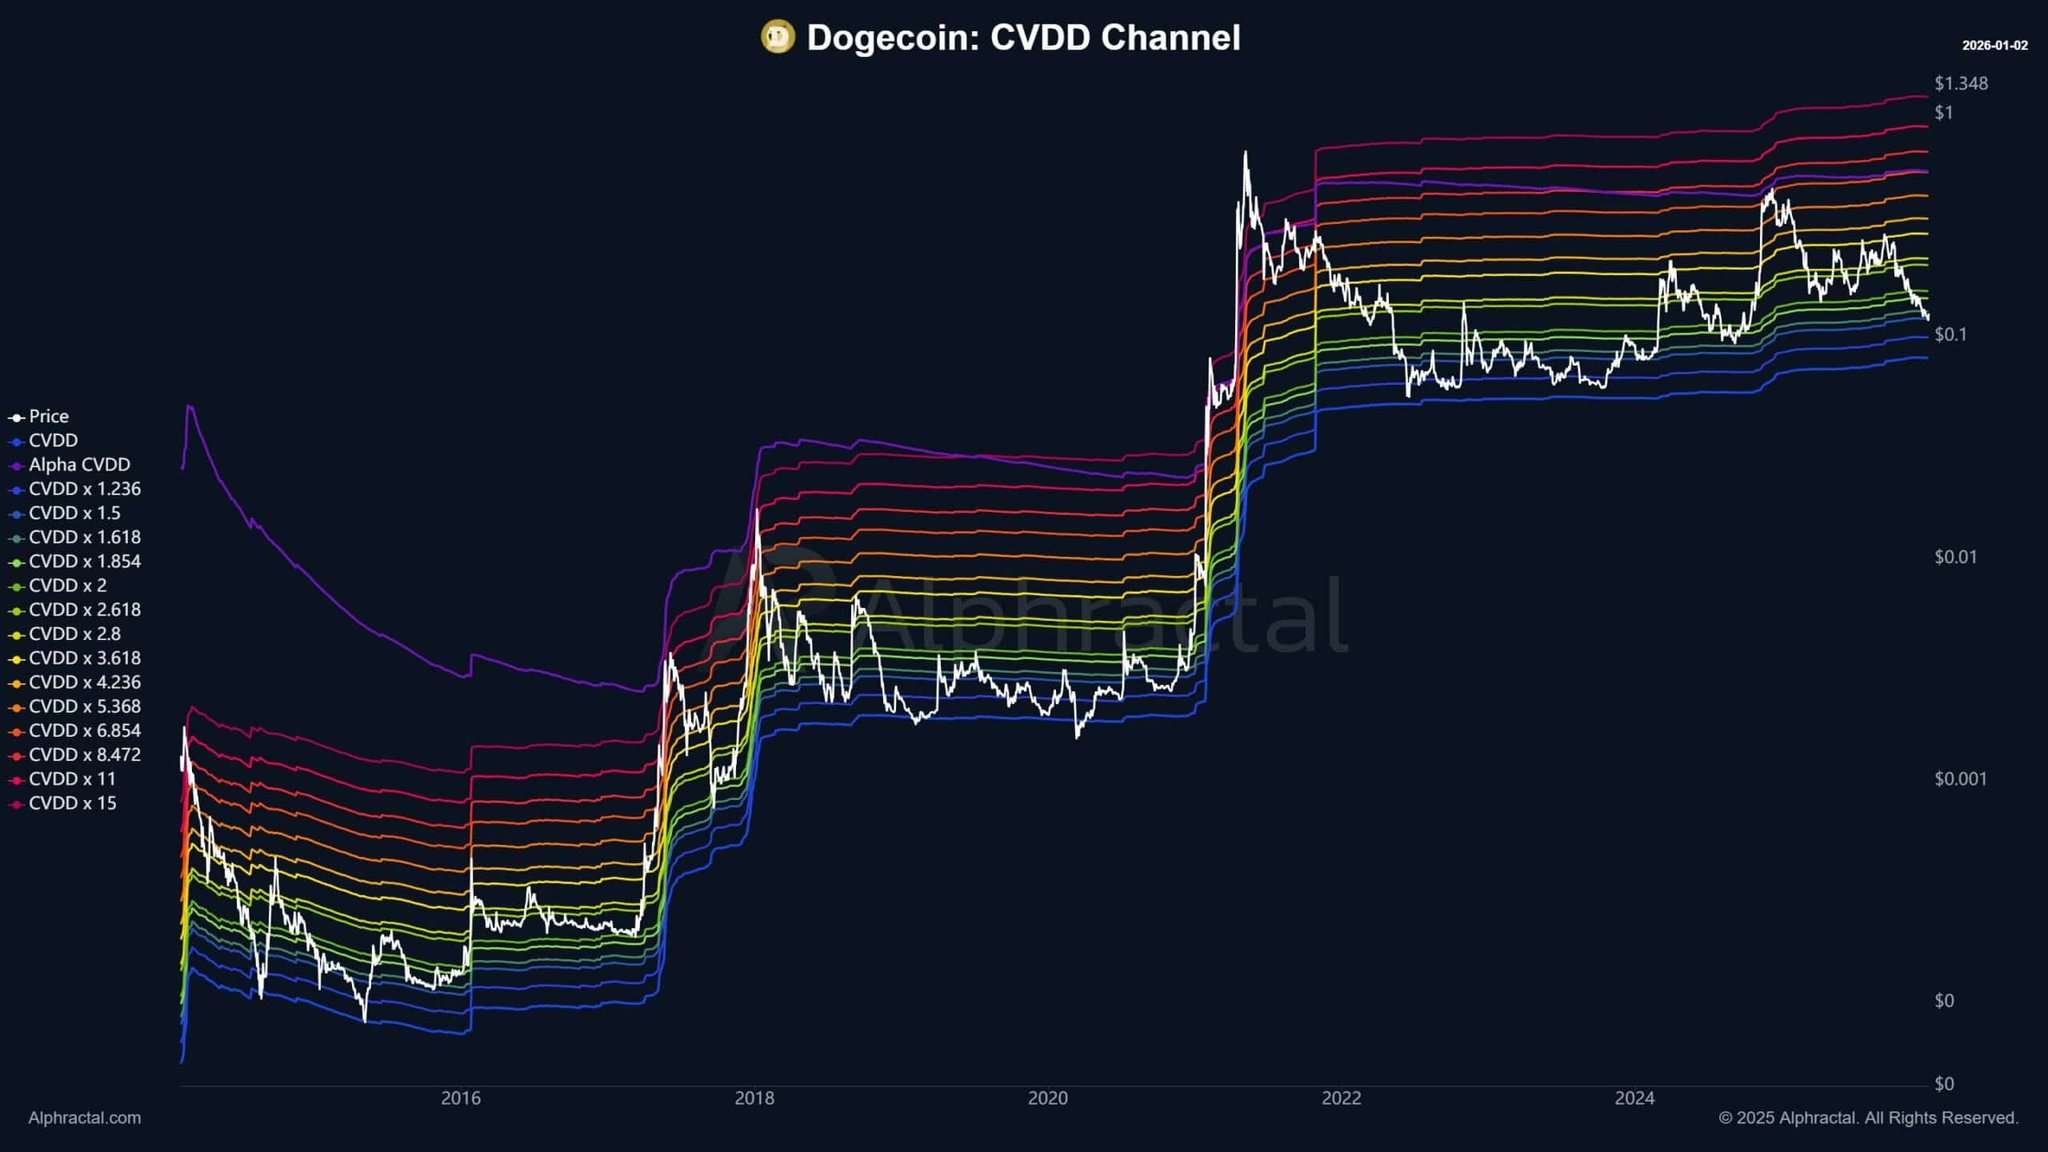
Analysts say that if the momentum keeps going, the memecoin could reach $0.26–$0.28. This would be a good thing for the bulls. On the other hand, skeptics say that the price could quickly drop back to $0.10 if support fails.
This is because the market was so volatile. Traders emphasized the significance of closely monitoring volume for confirmation. Moreover, there needed to be a balance between excitement and caution.
DOGE Liquidation Heatmap: Insights Into Recent Volatility
According to Coinglass data, Dogecoin had a lot of liquidation activity in the last 24 hours. The heatmap showed that the most liquidations happened between price levels of $0.140 and $0.147.
These were high-intensity zones. The zone between $0.138 and $0.141 saw a total of $4.71 million wiped out. At lower levels, like $0.135, there was not much going on.
In fact, the price had been going up and down between the highs of about $0.145 and the lows of about $0.138. The sharp drops lined up with liquidation spikes, which suggested cascading sells.
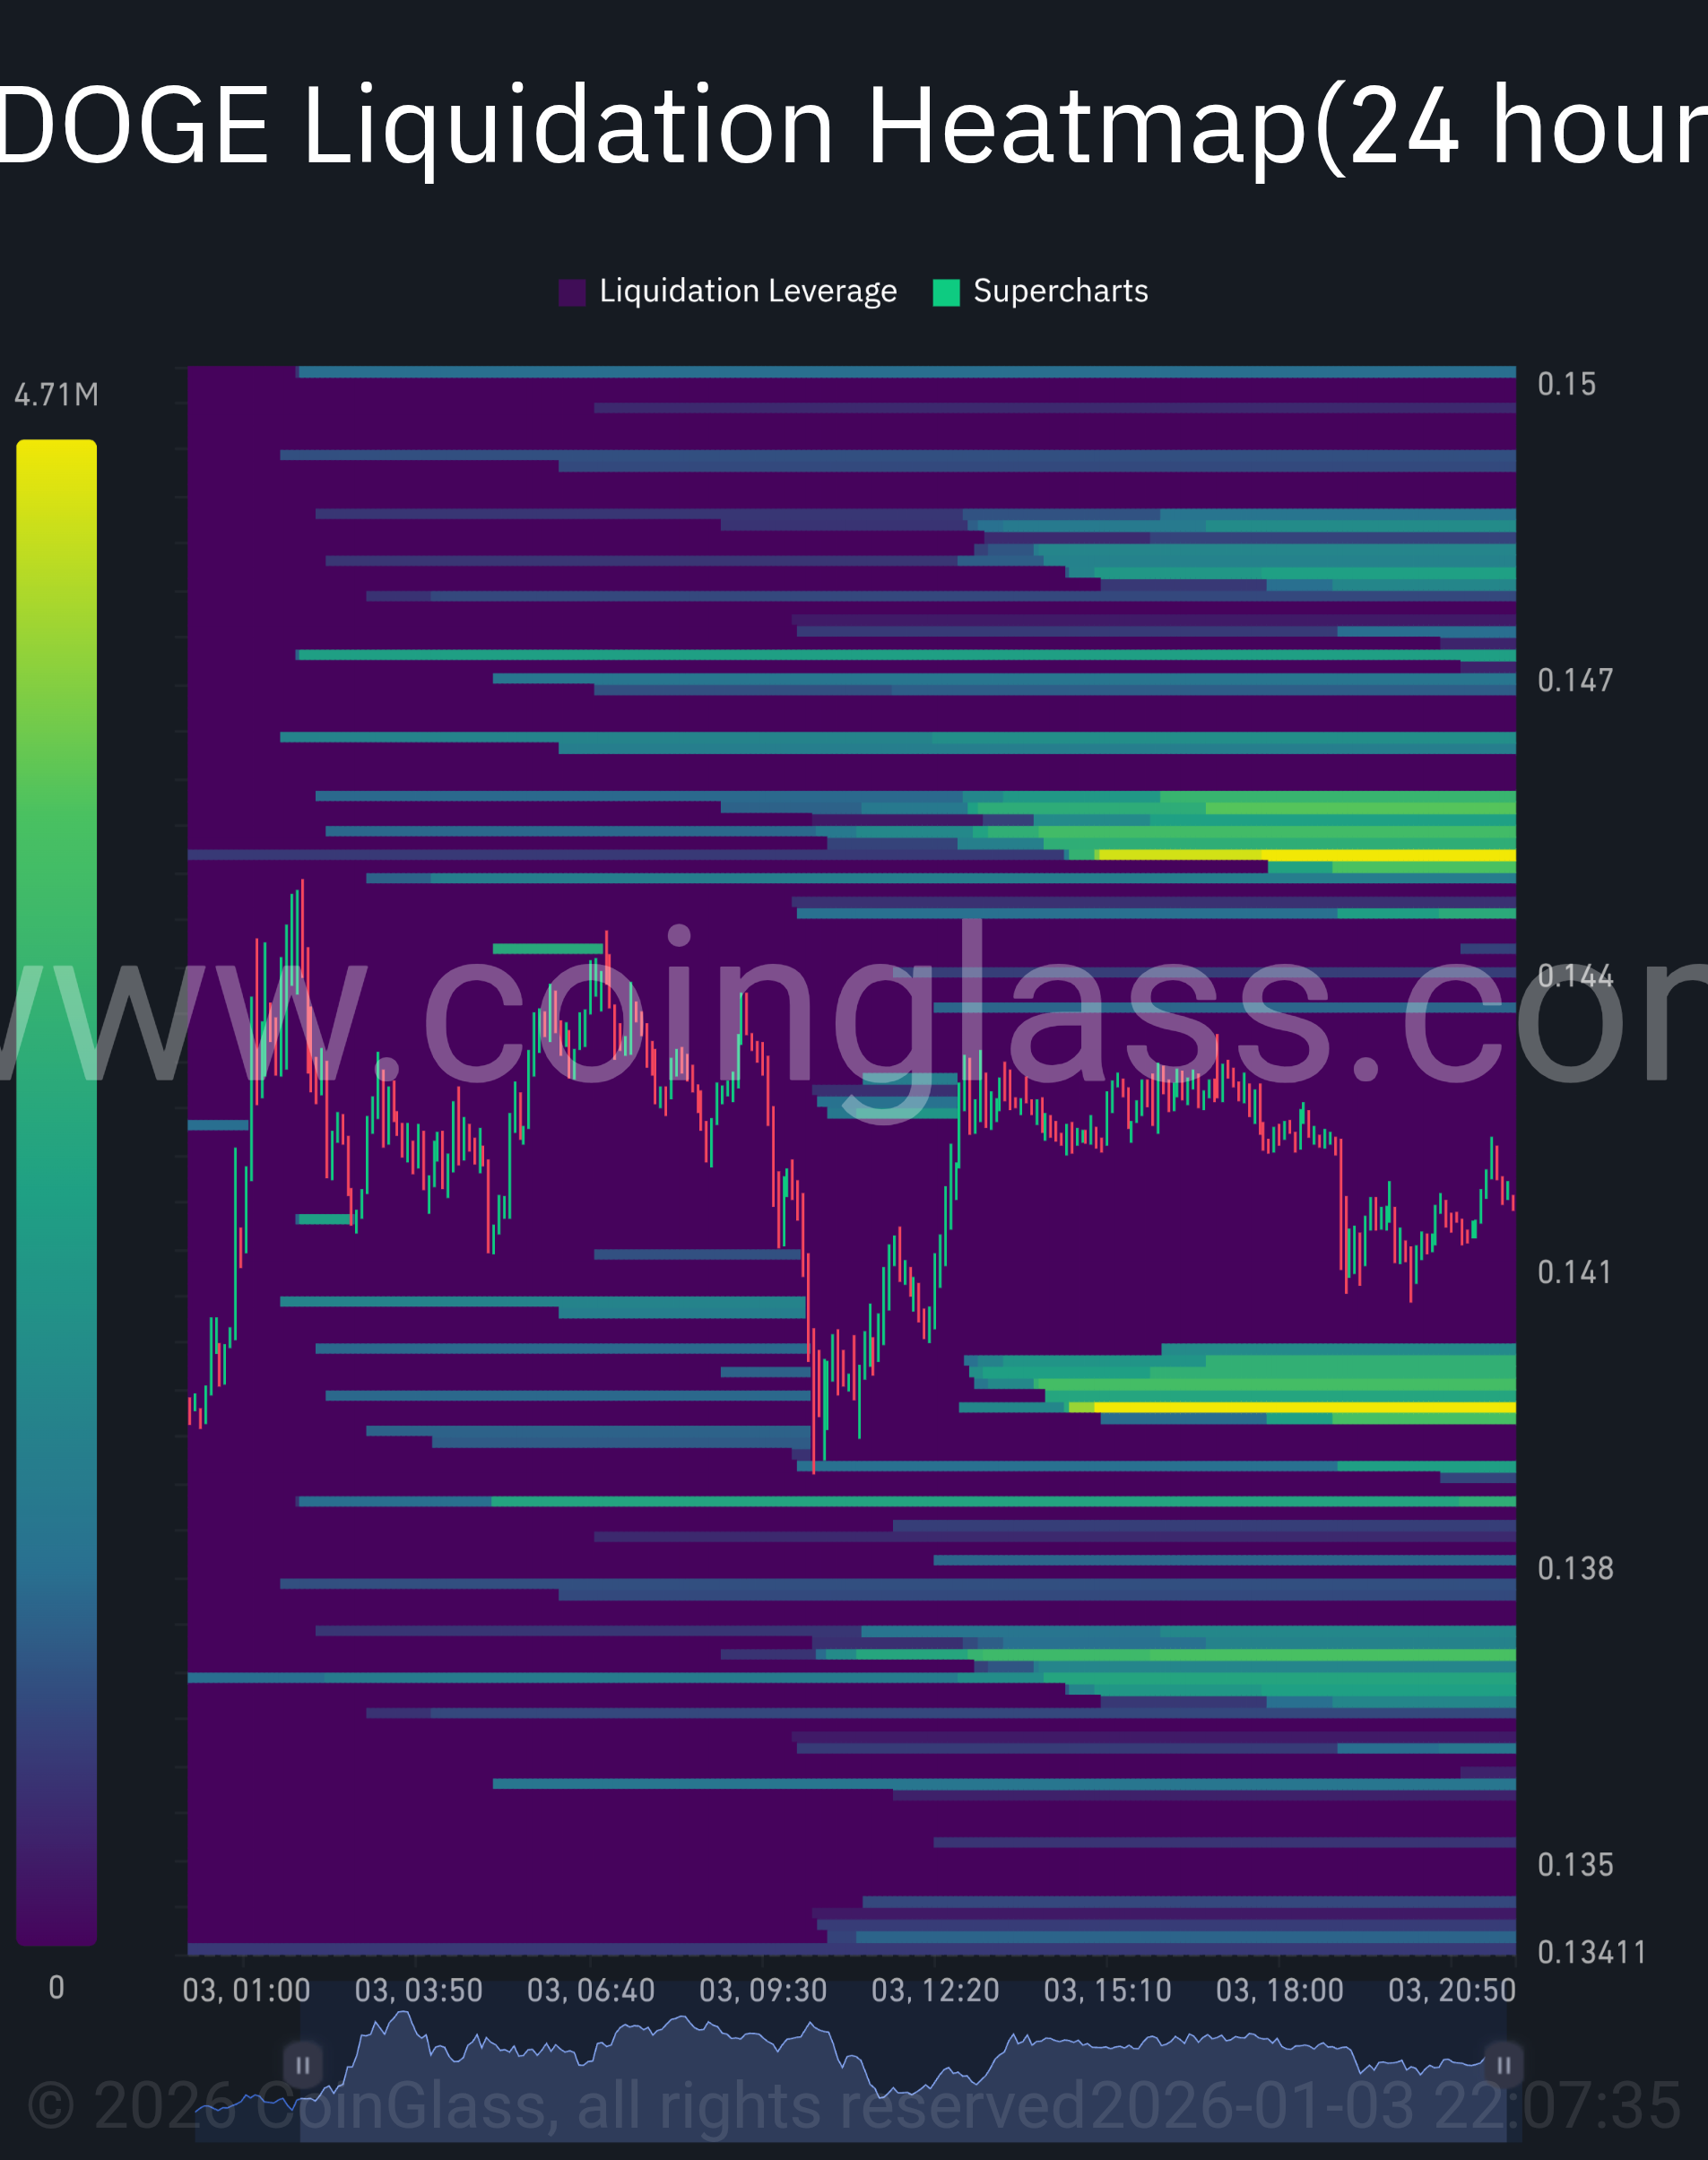
This volatility got rid of positions that were too leveraged. These positions could have made the market more stable. If liquidity traps went down, the price could rise to $0.15.
If pressure stayed on, the price could drop to $0.134. These analyses indicated the market was getting fatigued while suggesting that changes in sentiment could lead to bigger downturns.



