Doge Pepe
 Crawlerpad
 Quant
Quant Pearl
Pearl Starknet
 Optimism
 Zylo Ecosystem

Bitcoin price remained under intense pressure on Saturday, continuing a trend that started in January when it peaked at $94,955. It has dropped to $90,000 as spot BTC outflows continued ahead of the upcoming US inflation data and the market structure bill markup.
Bitcoin Price Pressured by Rising ETF Outflows
Spot Bitcoin ETFs started the year well as they recorded over $1 billion in inflows in the first three trading days. Recently, however, the situation has shifted, and demand for these funds has declined.
Data compiled by SoSoValue shows that spot Bitcoin ETFs shed over $249 million in assets on Friday as the coin remained in a tight range at $90,000. It was the fourth consecutive day of outflows, which brought the weekly outflow figure to over $681 million. Bitcoin ETFs had $458 million in inflows a week earlier.
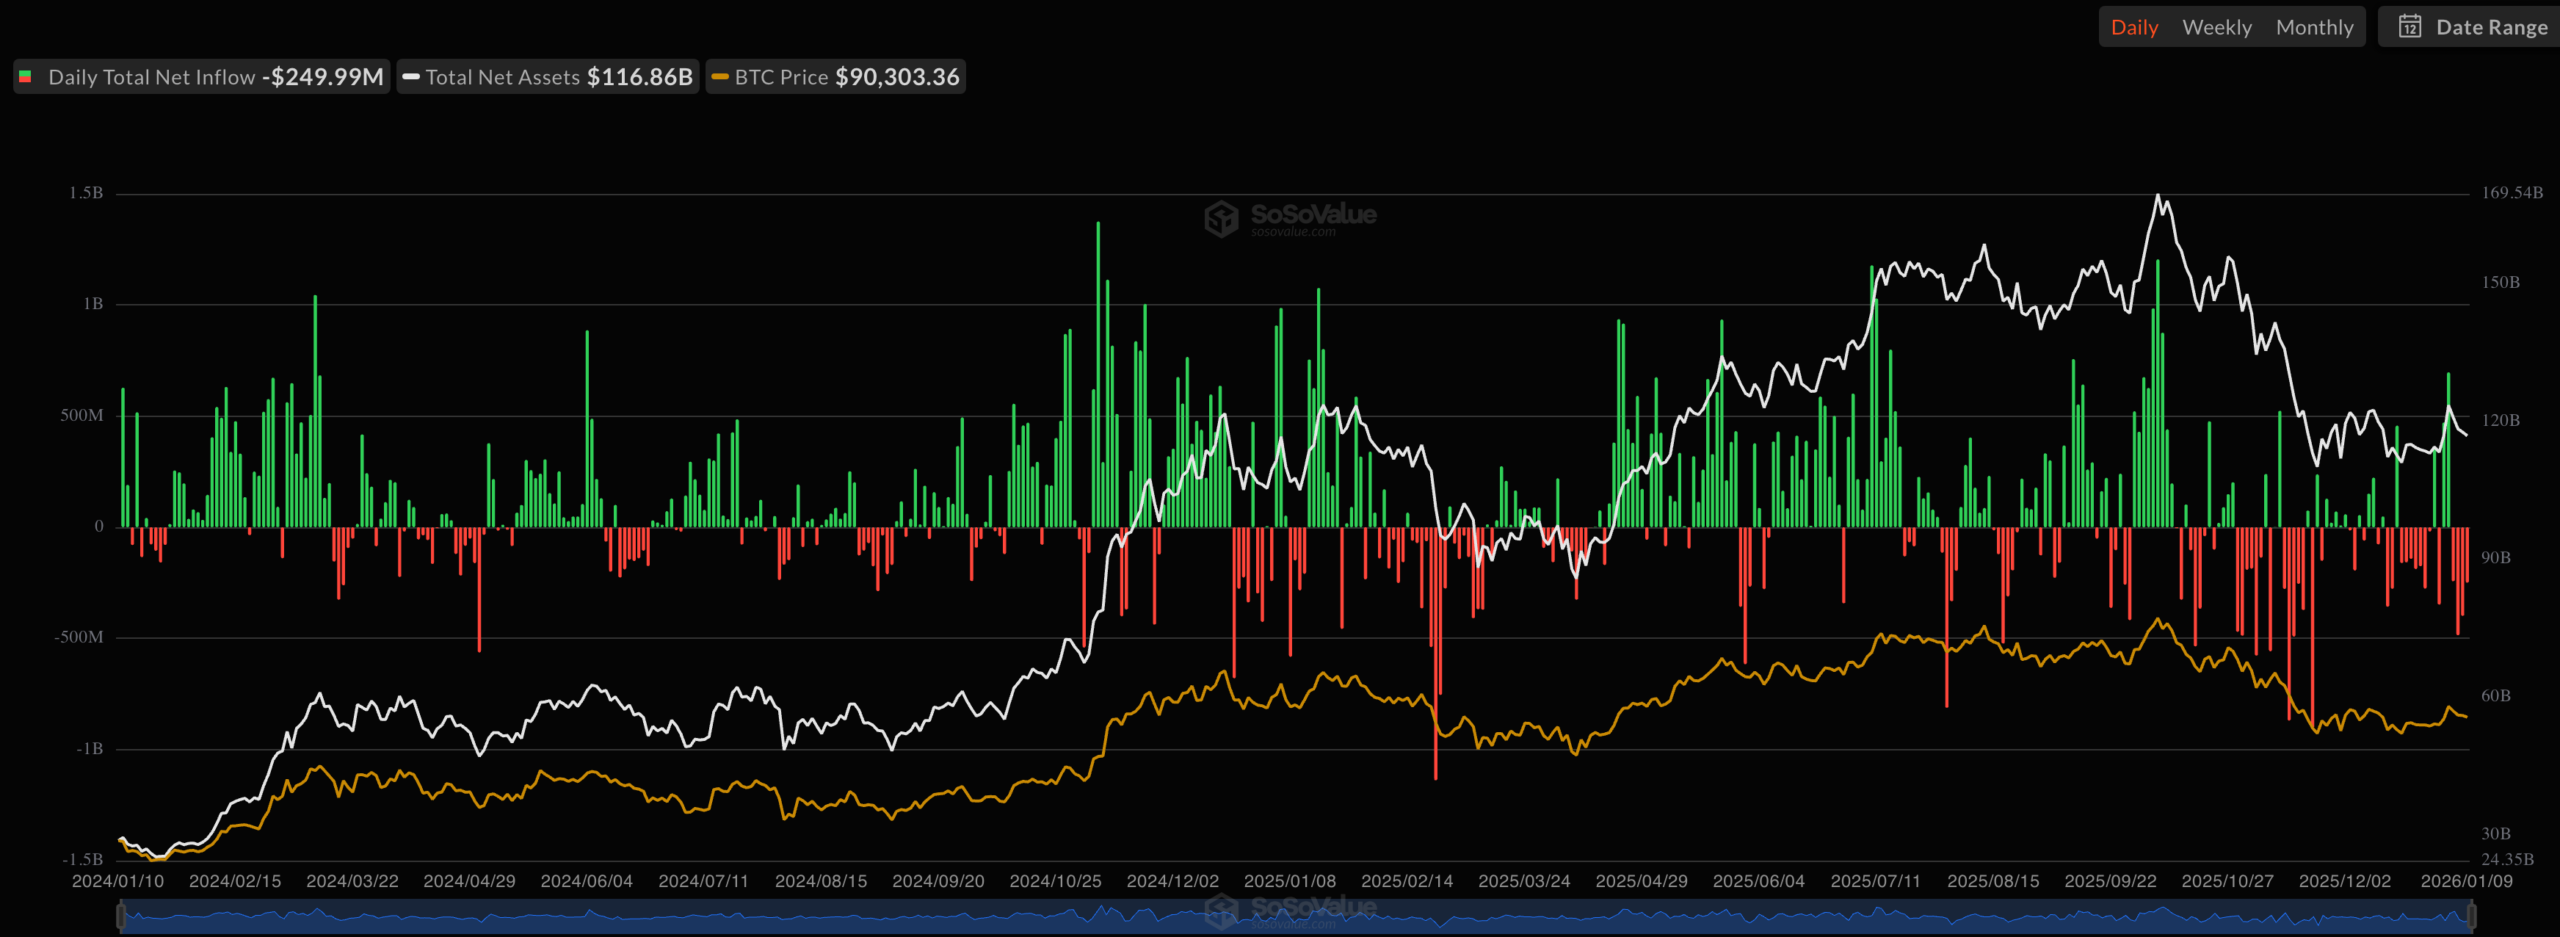
BlackRock’s IBIT shed $251 million in assets on Friday, bringing its total assets to nearly $70 billion. Most Bitcoin ETFs, like those by Grayscale, Ark Invest, VanEck, and Invesco, did not have any activity on Friday.
The rising ETF outflows is happening as American retail and institutional investors pare back their positioning in Bitcoin. There are also signs that some of the investors are moving to other crypto ETFs like XRP and Solana.
US to Publish Inflation Report
Spot Bitcoin ETFs experienced an outflow on Friday after the Bureau of Labor Statistics (BLS) released the latest US jobs data. It confirmed that the labor market was softening.
The economy created 55k jobs in December, much lower than the median estimate of 70k. Also, the unemployment rate fell to 4.4% while wage growth remained strong.
Looking ahead, the next key catalyst for Bitcoin price will be the upcoming US consumer price index (CPI) data. It will be released on Tuesday of next week.
This inflation report is important because, together with the jobs numbers, it forms part of the Federal Reserve’s dual role. Data compiled by TradingEconomics shows that the headline and core Consumer Price Index (CPI) moved to 2.6% in December.
An inflation report that is lower than the estimates will be a major relief to the Fed and the Trump administration. It means the bank will be open to delivering more interest rate cuts this year. The last minutes showed that most officials were open to more cuts.
SCOTUS Ruling on Trump’s Tariffs
Looking ahead, the next significant catalyst for Bitcoin will be the upcoming Supreme Court decision on tariffs. This ruling, which was initially scheduled for Friday, will likely come out on the 14th.
There are two scenarios in this decision. The most likely scenario, based on the oral arguments last year, is that the court will strike down the tariffs and compel the administration to offer refunds. Such a move would be bullish for the Bitcoin price, as it would mean lower prices in the US.
However, Trump has more measures to ensure that the same outcome remains, meaning that Bitcoin’s recovery is short-lived. The SCOTUS may also decide to vote in favor of the Trump administration.
Bitcoin Price Technical Analysis
The daily timeframe chart shows that Bitcoin price has formed a highly bullish chart pattern known as an ascending triangle. This pattern is made up of a diagonal line that connects the lowest swings since November last year.
It also has a major resistance, which, in this case, is at $94,955. This often leads to more gains in an asset. It has also moved above the 25-day Exponential Moving Average.
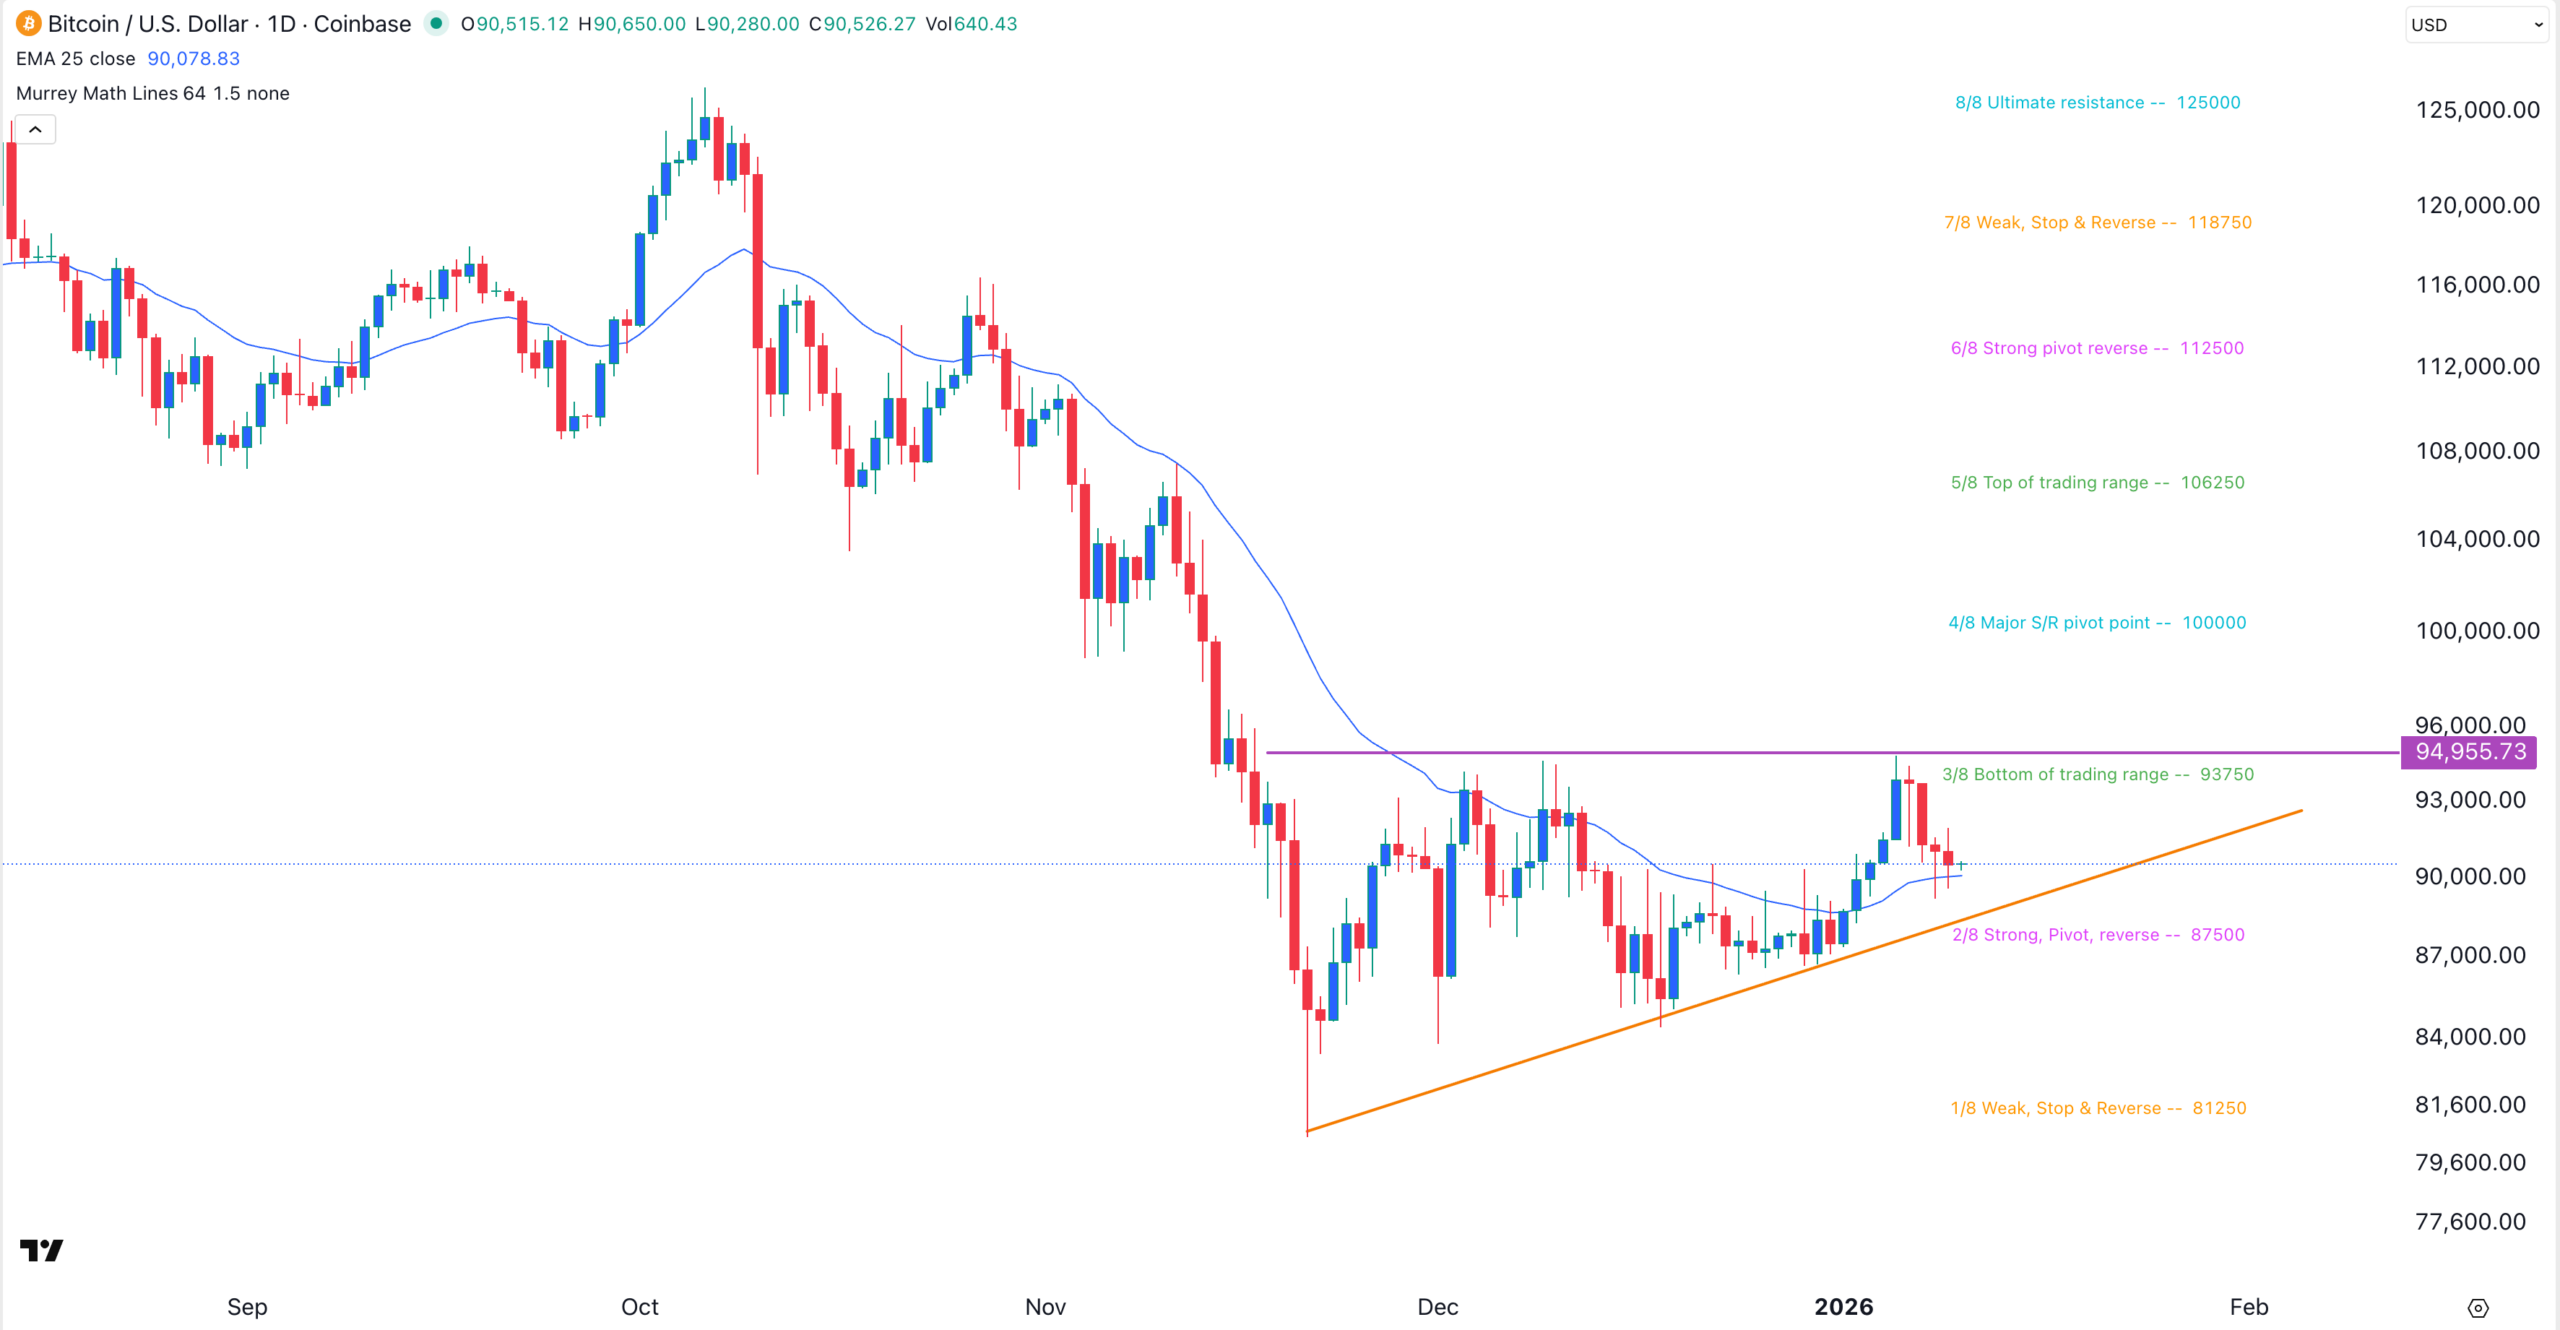
Therefore, there is a likelihood that the Bitcoin price will rebound in the coming weeks. A move above the upper side of the ascending triangle will point to more gains over time. The next key target to watch will be at $100,000, the Major S/R pivot point of the Murrey Math Lines tool.