Wisp
Wisp Crawlerpad
 Pearl
Pearl Zylo Ecosystem
 Quantus
 Sonic
Sonic Pudgy Penguins

SUI price is stabilizing after a long correction in a larger uptrend structure. Multiple analysts are now pointing to strong technical confluence for renewed upside momentum. Attention is focused on whether buyers can defend the $1.60 zone.
SUI Price Structure Remains Constructive
The SUI price continues to trade within a well-defined ascending channel on the weekly chart. This structure has been in control of the price action since early 2024. Ali Martinez pointed out that the bottom of this channel is around $1.60. As long as this level remains, the broader bullish structure is in place.
The weekly chart showed an increasing number of lows forming in spite of recent volatility. This pattern indicates controlled pullbacks over structural breakdowns.
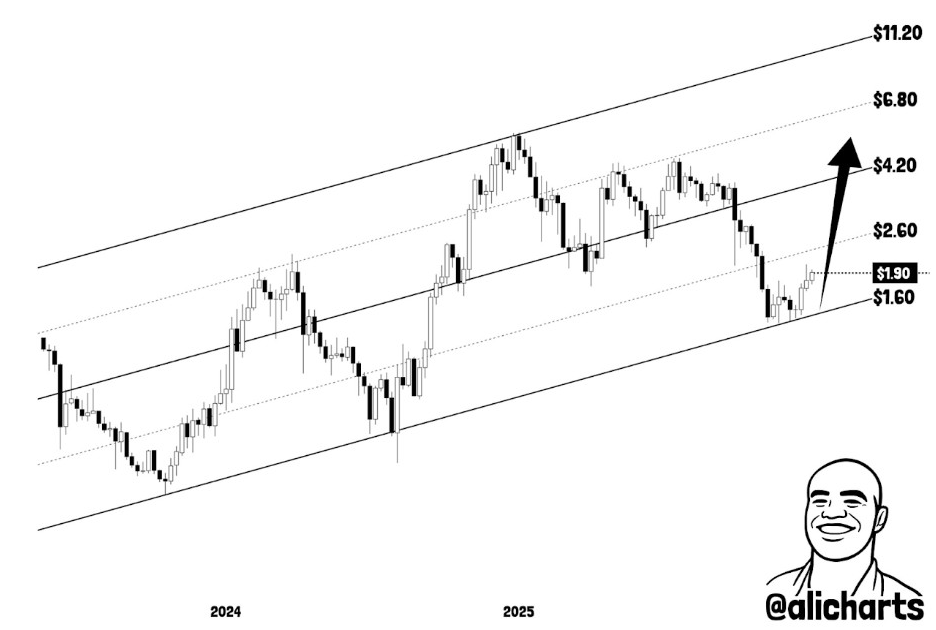
Martinez found $2.60 to be the first upside objective in the channel. A move beyond that level would reveal the upper boundary around $4.20.
The channel slope reflects gradual expansion rather than parabolic behavior. That characteristic often facilitates the development of sustained trends. SUI price also regained mid-channel support after a dip. This recovery reinforces the sentiment that buyers remain active at key levels.
Momentum Signals Align with Channel-Based Support
Short-term momentum indicators help to add context to the see-sawing price action. James Easton pointed out that SUI crypto price just tagged the lower channel trendline.
That test coincided with readings of momentum oscillators being oversold. Historically, similar conditions have preceded upward reactions in the channel. Easton described the setup as being technically beautiful rather than euphoric. Momentum has reset without breaking higher time frame structure.
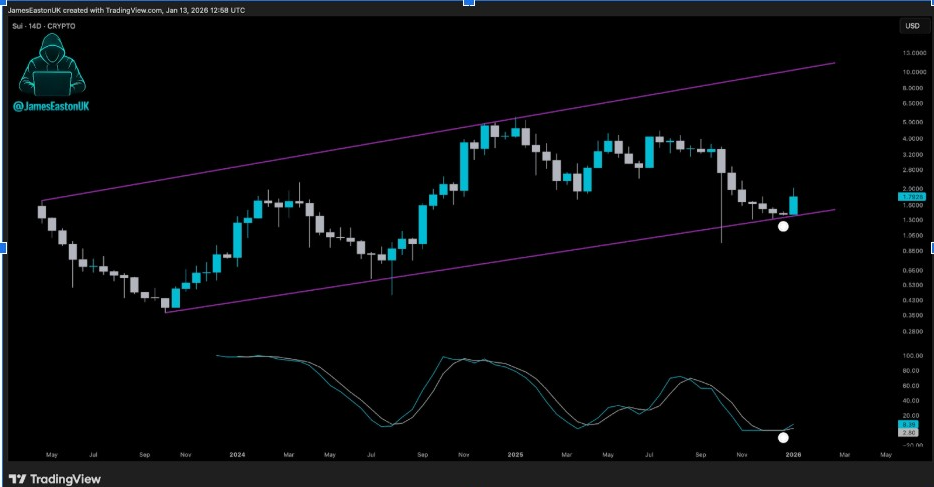
The chart also shows declining selling pressure into support. That behavior indicates that the distribution is weakening more than accelerating. SUI price bounced modestly after the support test. This reaction has the advantage of maintaining the technical validity of the trend.
While momentum is still muted, it is no longer a sign of aggressive downside risk. Continuation depends upon sustained closes above short-term resistance.
Monthly Trend Favors Expansion if Support Persists
Zooming out, SUI crypto price monthly chart brings more clarity. Analyst Bitcoinsensus pointed out that SUI price is within a long-term uptrend channel.
This channel has included all significant swings since the early expansion phase of the asset. Pullbacks have always respected the higher lower boundary.
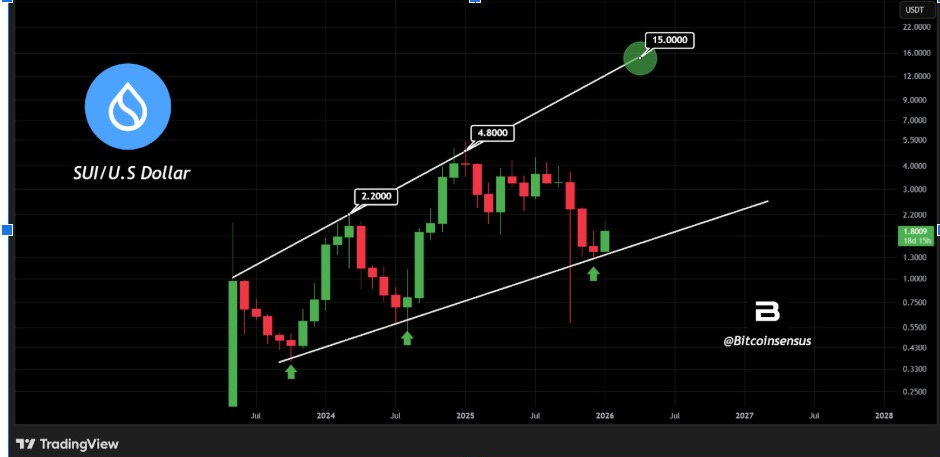
The most recent monthly candle is a price stabilizing above the support of the channel. That placement helps to lower the chance of trend invalidation.
Bitcoinsensus said a recovery towards previous highs near $4.80 is likely. Beyond that, the channel projection is extended for $15 over the long term. Such targets rely on stable market participation and broader risk appetite. They are not framed as near-term expectations.
The monthly structure emphasizes patience and discourages immediate breakout anticipation. Trend-based strategies are usually inclined to this type of gradual setup.
Measured Breakout Scenarios Highlight Asymmetric Upside
Another angle focuses on compression patterns within the wider uptrend. Don of Charts identified a descending line of resistance that was squeezing the price action. This structure resembles a falling wedge that forms above the long-term support level. Such formations often are higher in resolution when aligned to macro trends.
Analyst Don projected a measured move to the $7.20 region. That target had been a potential 400% expansion from the base of the wedge.
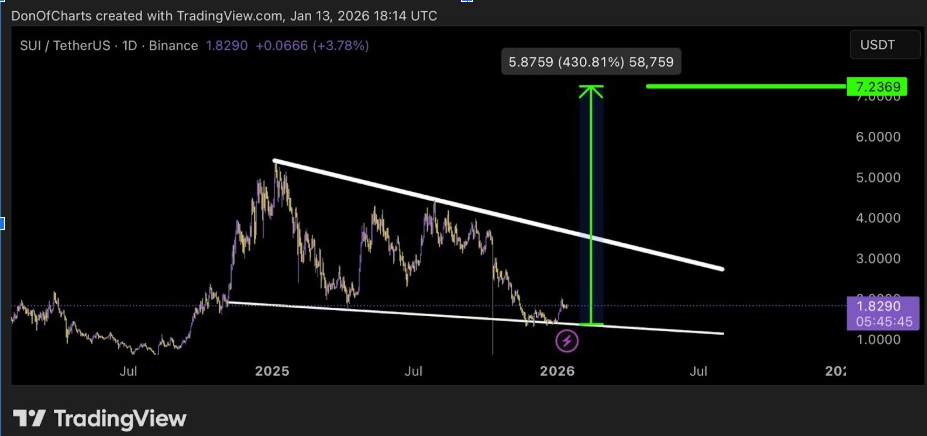
The projection is based on an assumption of a confirmed breakout above descending resistance. Until then, the SUI crypto price may continue to consolidate near current levels.
SUI crypto price is currently trading around the bottom of the wedge. Such positioning offers a favorable risk-to-reward ratio for trend followers. If support fails, the bullish trend is weakened, while repeated defenses of the same zone increase its technical significance.