
 Pearl
Pearl Bitway
 Walrus
 Optimism
 Pons
Pons Quantus
 NEAR Protocol

XRP price is holding close to an important support zone after recent signs of a potential short-term rebound.
Multiple analysts have pointed out bullish signals that may indicate an upside shift if momentum increases. For now, the $1.70 level is still an important floor separating further downside from a breakout opportunity.
XRP Price Finds Support Near $1.70
Market analyst Ali Martinez recently commented on a bullish TD Sequential “9” signal on the XRP 4-hour chart. This signal, often associated with local bottoms, indicates that the XRP price attempts a short-term bounce.
However, the signal will only hold strength if XRP continues to hold its position above $1.70 in the coming days.
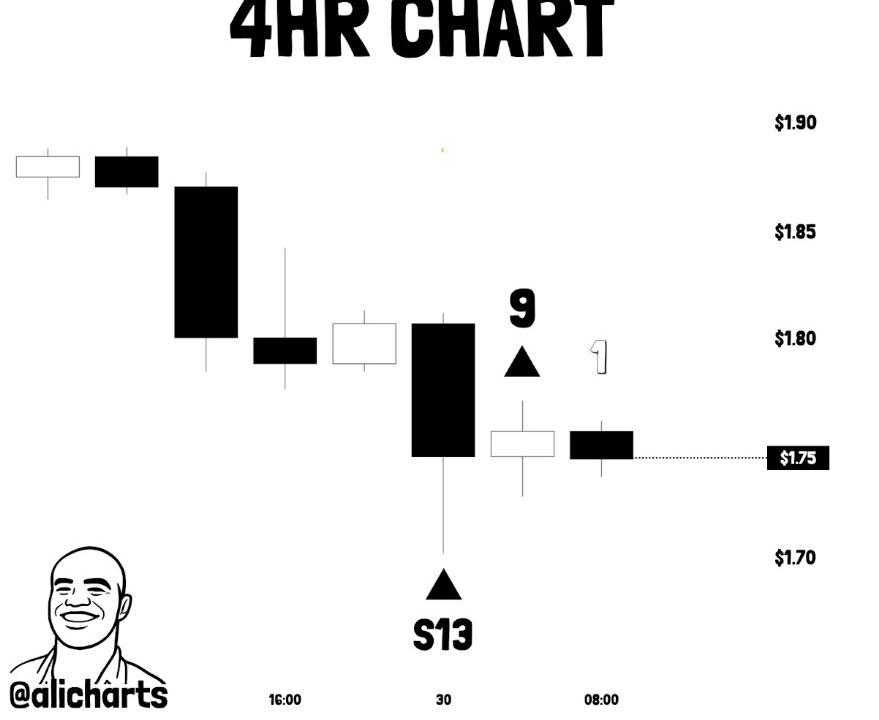
So far, the XRP price has stabilized around $1.75 after the signal. However, momentum has yet to confirm a strong recovery. Trading volume across major exchanges is still low. This means that conviction from bulls is still developing.
Still, there is the $1.70 area. It has seen historical significance as a support zone, adding weight to this attempt to reverse.
Martinez said recovering $1.80 boosts bullish probabilities. He noted that this recovery could pave the way for a stronger move. Until then, the asset is at risk of downside pressure and profit-taking by short-term traders.
XRP Price Faces Resistance at $1.80
While the bullish signal remains intact, XRP continues to encounter strong resistance around the $1.80 level. Analyst Crypto Tony highlighted that failure at this level would be repeated.
This might pave the way for lower prices. In particular, a drop towards the $1.57 area is still possible if buyers do not break above resistance any time soon.
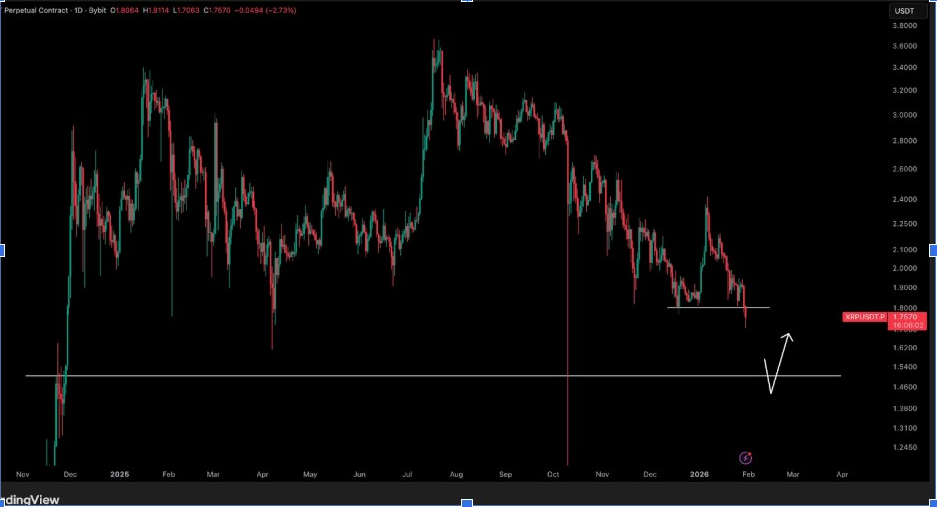
That $1.57 zone has been a major pivot in previous market cycles and coincides with trendlines from 2024 and 2025.
Technical indicators also remain mixed; the RSI is near neutral levels, and the MACD is showing slight divergence. This suggests that although the setup is constructive, a definitive breakout has yet to take place.
XRP price staying below $1.80 keeps traders cautious. Many remain defensive in their positioning. This level acts as a key threshold for sentiment. A decisive close above this level daily would change the sentiment and likely bring stronger inflows into the asset.
Ripple Consolidates Within Base Zone
Analyst BitGuru stated that the XRP price is consolidating. He identified a larger accumulation range. This range spans between $1.70 and $2.20.
He noted that this zone has been providing good support ahead of impulsive upward moves in past cycles. This view is reinforced by the recent liquidity sweep, which may have cleared weaker hands from the market.
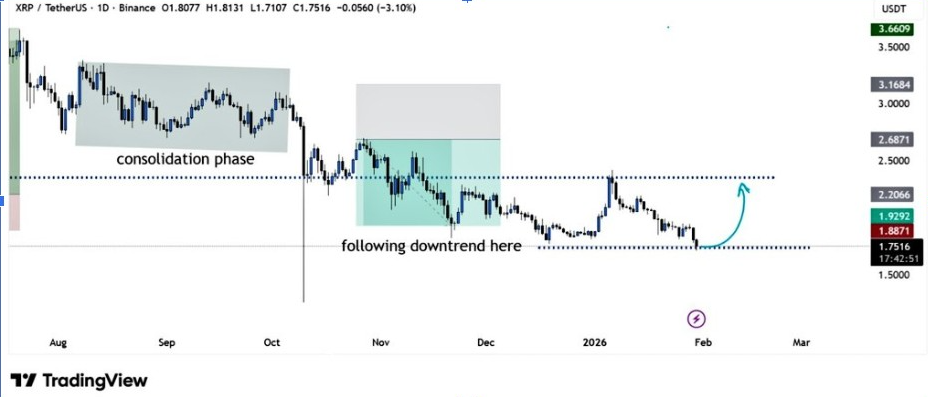
BitGuru also highlighted the fact that XRP is trading in a classic compression structure. This structure is often a precursor to explosive moves once momentum breaks one way or the other. However, a close below $1.70 would nullify the current accumulation thesis and open downside risks.
In order to take control back, bulls need to push the price above $1.85. That’s the very top of the current consolidation zone. So far, the pattern is still intact, but conviction is still low as the broader market sentiment is still mixed.
Long-Term Fractal Hints at Rally Toward $27
More so, analyst ChartNerdTA has provided a long-term fractal indicating similarities to XRP’s 2016-2017 cycle.
In that cycle, XRP price hit higher lows for several months before a breakout, which triggered a massive rally. The current structure is taking a similar course, but it has not been confirmed yet.
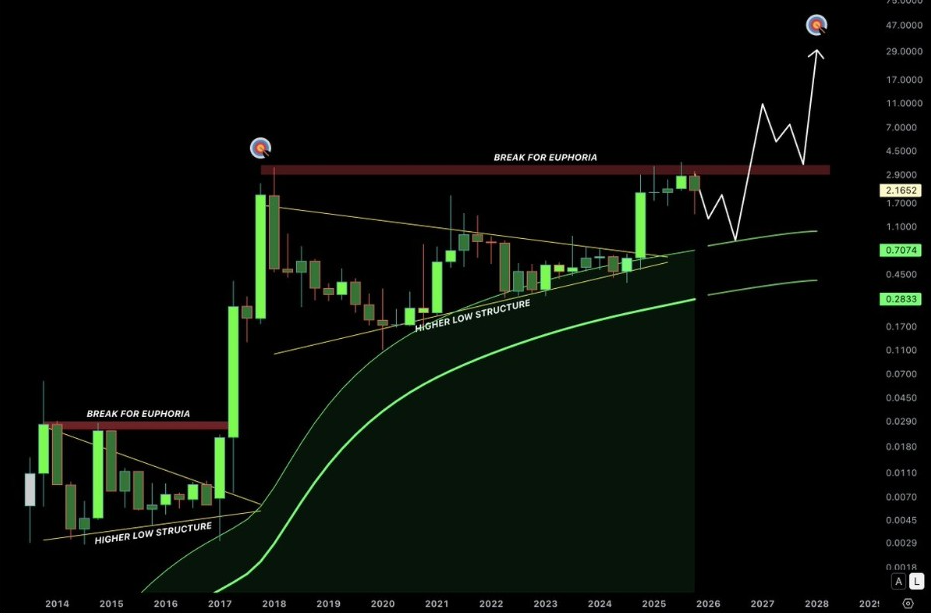
According to the chart, if XRP breaks above $3.00, the historical fractal suggests a potential move towards $27. While speculative, the pattern is gaining traction among traders who track long-term momentum shifts.
ChartNerdTA emphasized that a monthly close above the macro resistance would be the only way to validate the bullish scenario.
On the other hand, failure to clear key resistance zones would negate the fractal and restore bearish momentum. Still, with XRP price having key levels, analysts are still monitoring to see if a macro reversal is forming.




