
 Pearl
Pearl Walrus
 Bitway
 Bitcoin
 Quantus
 Quant
Quant Pudgy Penguins

Solana price is gaining renewed attention after the on-chain data showed a sharp drop in exchange-held supply. Over a million SOL tokens were withdrawn from centralized exchanges in a very short time. The movement implies tightening liquidity as traders reposition around key price levels.
Solana Price Reflects Exchange Supply Shock
Solana price is reacting to a significant change in on-chain supply dynamics. Data shared by Ali Charts indicates that more than 1.07 million SOL were withdrawn from exchanges in the past 72 hours. These movements usually alleviate short-term selling pressure, particularly in times of consolidation.
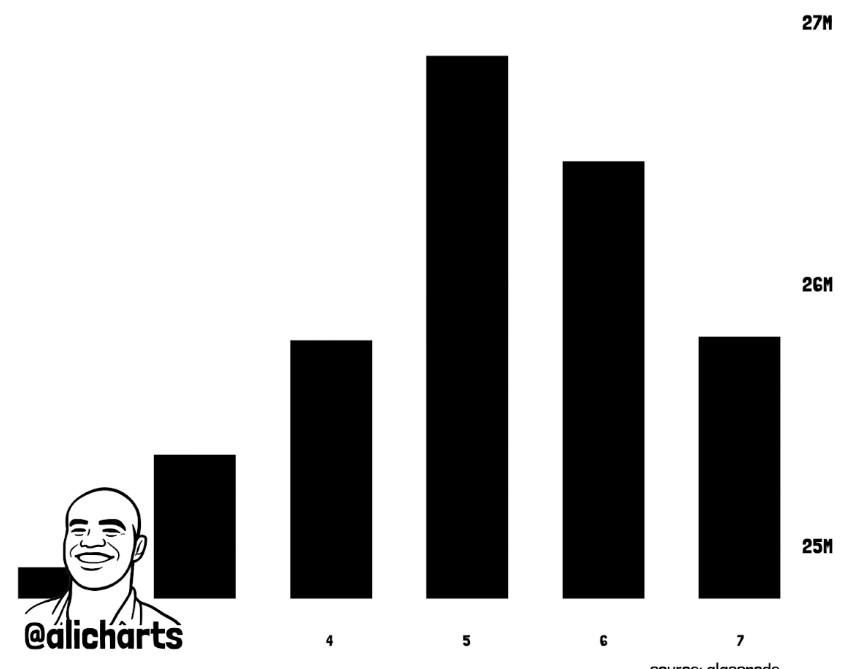
When large volumes of tokens leave exchanges, they are often moved into cold storage or long-term holding wallets. This behavior reduces the liquidity available for spot selling and may make prices more sensitive to new demand. Historically, contractions in supply have been followed by stronger price expansions in Solana price cycles.
Moreover, Glassnode data shows a clear downtrend in exchange balances over the last few sessions. The pattern suggests sustained accumulation rather than short-term speculative movement. As exchange reserves shrink, the market tends towards greater volatility, especially when demand returns.
Nevertheless, a supply shock does not necessarily mean an immediate upside. Broader market sentiment and macro liquidity conditions are critical. Still, the decrease in exchange balances supports a tightening Solana price setup.
Solana Price Finds Long-Term Support After Long Correction
Solana price has been consolidating for several months after a sharp corrective phase. Weekly charts show SOL repeatedly defending a historically important support zone. This same region had served as a base before earlier multi-month advances.
Trader Tardigrade pointed out that Solana price is forming a rounded base pattern on higher timeframes. According to his analysis, this structure is similar to previous cycle lows that were followed by strong recoveries. Such formations tend to reflect the gradual absorption of selling pressure.
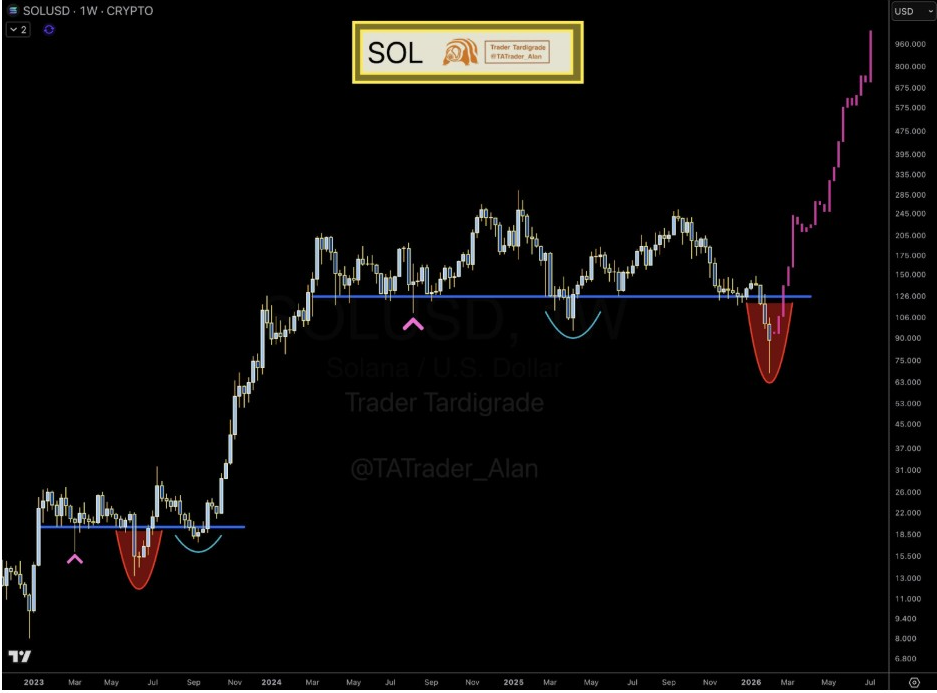
Additionally, price action indicates higher lows forming above the long-term horizontal support. This behavior indicates buyers are more willing to step in on dips. Over time, this tends to shift control of the market out of the hands of the sellers.
SOL Price Builds Momentum as Structure Improves
Solana price structure has improved on both medium and lower time frames. Recent sessions show less downside follow-through and tighter trading ranges. These characteristics are often evident after sellers lose momentum.
Analyst Don of Charts highlighted a descending resistance trendline approaching resolution. He noted that Solana price has respected this structure for months as it compressed beneath it. A confirmed breakout could open the path towards significantly higher levels.
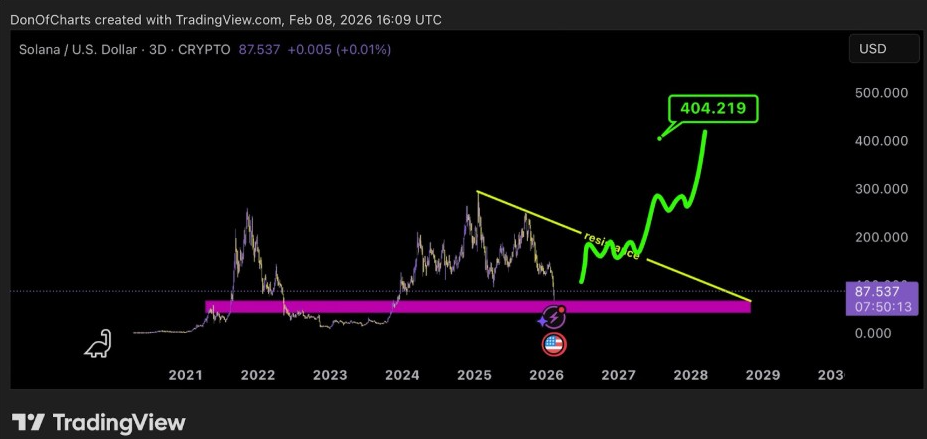
Volume trends also support this view. Trading activity has stabilized after a long contraction, which is often a signal of getting ready for expansion. Markets generally go flat before volatility returns.
At the same time Solana ecosystem measures are resilient. Network activity and development engagement have not imploded during the correction. That underlying strength underpins the improvement in the technical picture and builds confidence in the structure.
Solana Price Outlook Depends on Cycle Structure
Meanwhile, Solana price is still technically valid in a broader market cycle. Analyst Man of Bitcoin analyzed SOL with the Elliott Wave analysis on higher timeframes. He noted that the price recently reacted from an important Fibonacci support.
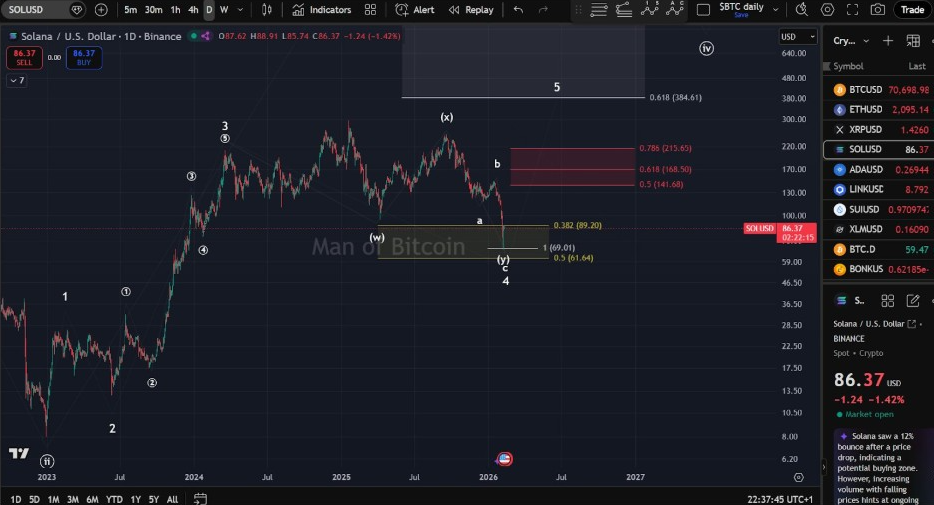
According to his assessment, the current structure indicates the possibility of wave four completing. As long as Solana price stays above support, technically, a final wave five advance is possible. This scenario is consistent with the past cycle behavior.
He had also found resistance clusters between $141 and $215. These levels represent the former distribution zones and could serve as upside targets if the momentum strengthens. To reach those areas, sustained demand and good macro conditions would be required.


