
 Doge Pepe
 Optimism
 Zylo Ecosystem
 Pearl
Pearl NEAR Protocol
 Pons
Pons Bitway

Ripple price is still on the watchlist, as exchange reserves are decreasing according to on-chain data, approaching almost 13 billion XRP. Price had earlier soared and then stabilized around an important zone of resistance. The most recent framework demonstrates decreased liquidity of the sell side and a managed pullback. Analysts are assessing whether reduced exchange supply supports medium-term stability.
XRP Price Divergence as Exchange Reserves Decline
According to analyst Steph Is Crypto, Glassnode data tracks total XRP assets held on exchanges against price performance. From 2021 through late 2024, balances steadily climbed toward approximately 18 billion XRP. During that period, the asset traded in a compressed range with limited directional expansion. Rising exchange balances often reflect distribution pressure as tokens become available for selling.
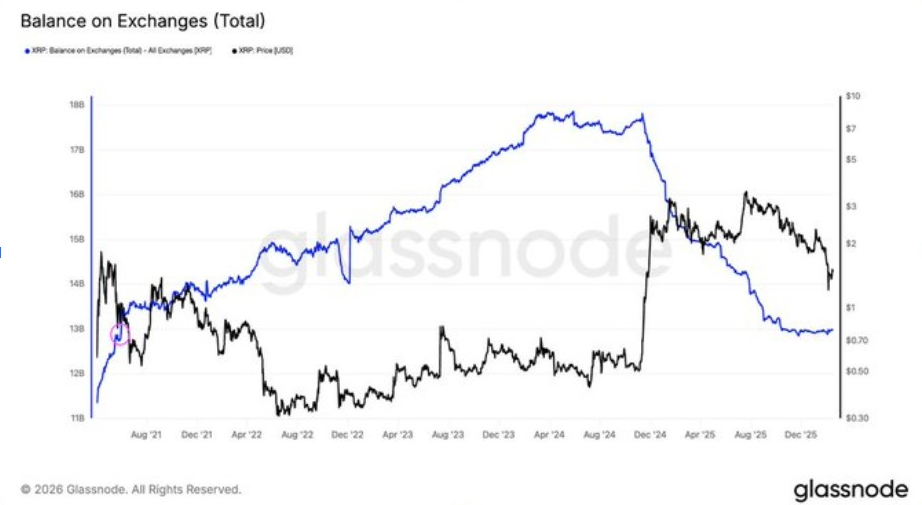
The structure, however, changed entering the year 2025 with the exchange reserves starting to lose momentum. Holdings reduced from about 17.5 billion XRP to about 13 billion XRP. In this time frame, XRP price recorded a strong upward trend, and then it went into a consolidation. Analysts interpret declining balances as movement into long-term storage rather than active trading supply.
In recent stages, the price reversed, currently at the local highs, with the exchange balances in a current downward trend. This deviation implies that coins are not returning to exchanges even as prices decline. Based on the data, the decrease in liquid supply may lead to tightening of the market. The trend suggests a possible accumulation period rather than distribution across the crypto market.
XRP Price Tests Breakout Zone Amid RSI Reset
Analyst Cryptobull, on the other hand, provided a weekly XRP/USD chart highlighting the long-term RSI cycle. RSI compressions were historical in 2018 and 2020 and were followed by significant expansion periods. This RSI zone has been a reflection of the previous reset zones, which are characterized by cyclical cooling. Such resets in the past have occurred during consolidations within larger bullish formations.
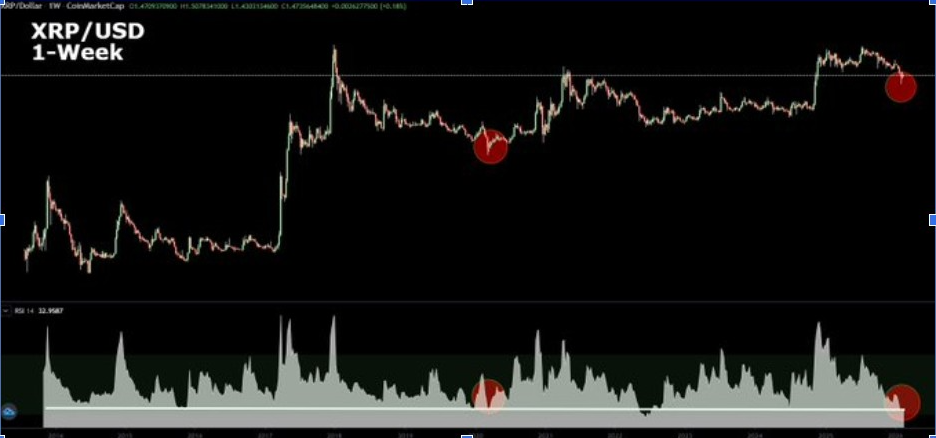
Moreover, the price movement indicates that Ripple price is retesting a multi-year horizontal resistance band. The asset shot up heavily into 2025 and then fell back into that breakout zone. The zone indicates a historical inflection point at which sentiment stabilized before growth. Analysts observed that structural support is confirmed by consolidation around preceding resistance.
Moreover, momentum indicators show declining strength but no structural breakdown in trend behavior. Historically, similar RSI resets occurred before continuation phases in prior cycles. The current structure reflects normalization rather than reversal, according to the chart. This positioning keeps XRP price within a broader expansion framework if support persists.
Multi-Year Triangle Keeps XRP Price at Crossroads
In addition, analyst JD outlined a monthly chart showing a multi-year symmetrical triangle formation. The formation dates back to the highest level of 2018, around the zone of $3.5. The upper limit links highs in the macro trend, whereas the lower curve follows a rising support in the long term. This compression represents the volatility compression over an extended range of accumulation.
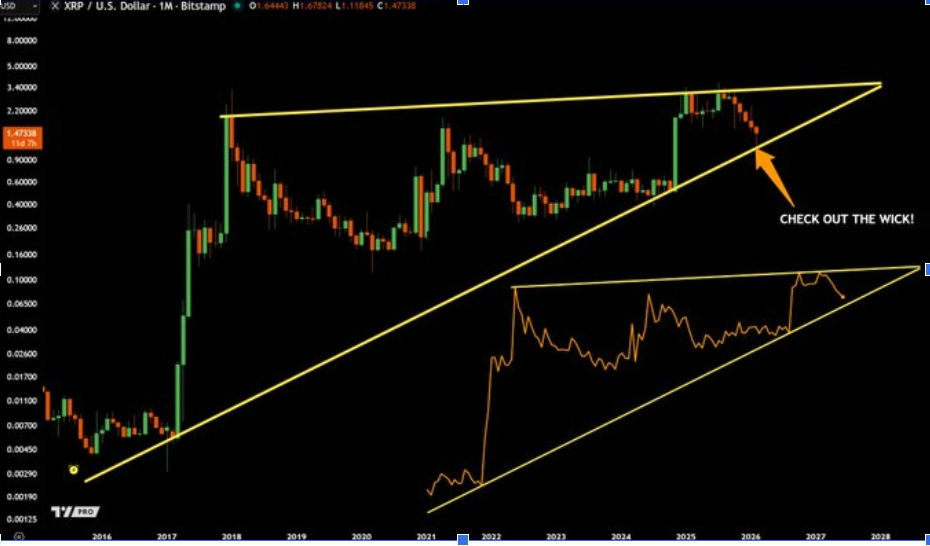
Most importantly, price recently approached the triangle’s upper boundary before rejecting with a large upper wick. Such a rejection implies a high selling pressure at macro levels of resistance. Nevertheless, such wicks are often observed in long-term compression patterns preceding decisive breakouts. The general framework remains intact as the price is above rising macro support.
Furthermore, lower momentum oscillators mirror a rising wedge formation. This pattern indicates gradual strength building despite prolonged consolidation. According to the chart, structural support remains the key level preserving the compression thesis. XRP price now trades near a multi-year decision zone defined by converging resistance and support.




