
 Doge Pepe
 Bitway
 Pons
Pons Sui
Sui Pearl
Pearl Ronin
Ronin Zcash
Zcash

Bitcoin is trading within a compressed range as traders weigh mixed signals from higher timeframes, liquidity maps, and ETF flows. Several charts shared today indicate that BTC is returning to a familiar support zone while momentum indicators are resetting. At the same time, crowded levels overhead are observed in the short term, keeping $67,000 to $68,000 as the area to watch.
Weekly RSI Hits Oversold as Bitcoin Price Tests Support
Trader Tardigrade flagged two conditions on the weekly chart that have previously appeared near important lows. The post featured a price falling to the bottom of a bullish channel. It also indicated that the weekly RSI had reached an oversold zone again.
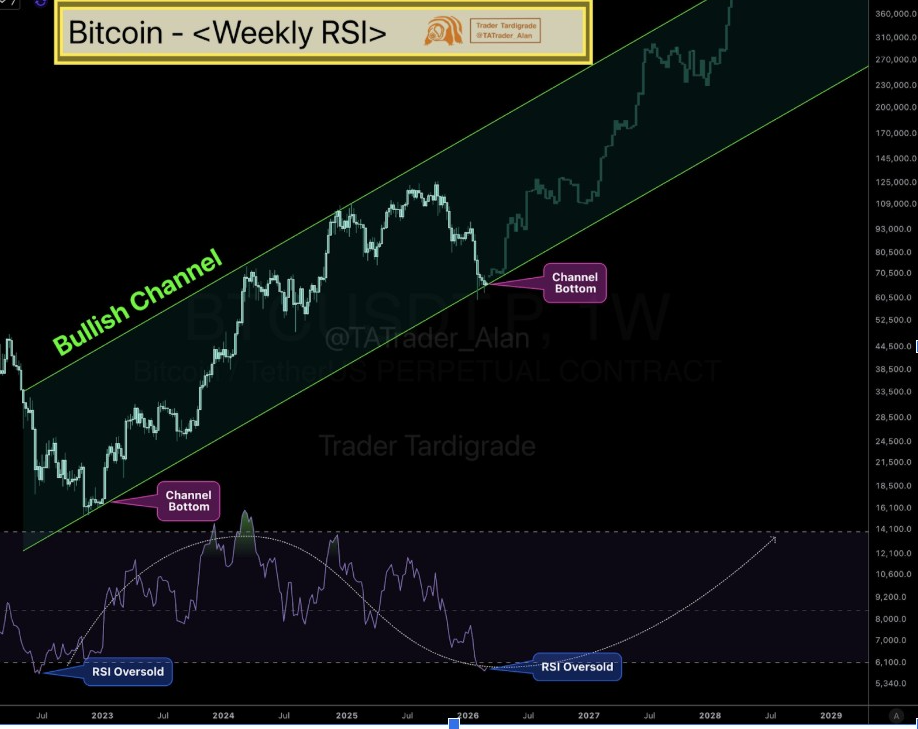
On the chart, the green channel encloses the larger uptrend structure. The recent price action is near the lower boundary marked “channel bottom.” The RSI panel also dips into the oversold band, as per earlier-cycle behavior depicted on the same chart.
The post proposed that in previous cases, Bitcoin price bounced back to new highs after these signals aligned. However, it presented the present moment as a question, not a guarantee. That leaves traders watching follow-through rather than assuming a repeat.
ETF Flows Turn Positive After 3 Weekly Outflows
Lennart Snyder has posted a trading plan that begins with a bearish bias. The post stated that Bitcoin is still traded in a compressed range after testing higher timeframe support. It also said the market is setting up around clarity pockets of liquidity.
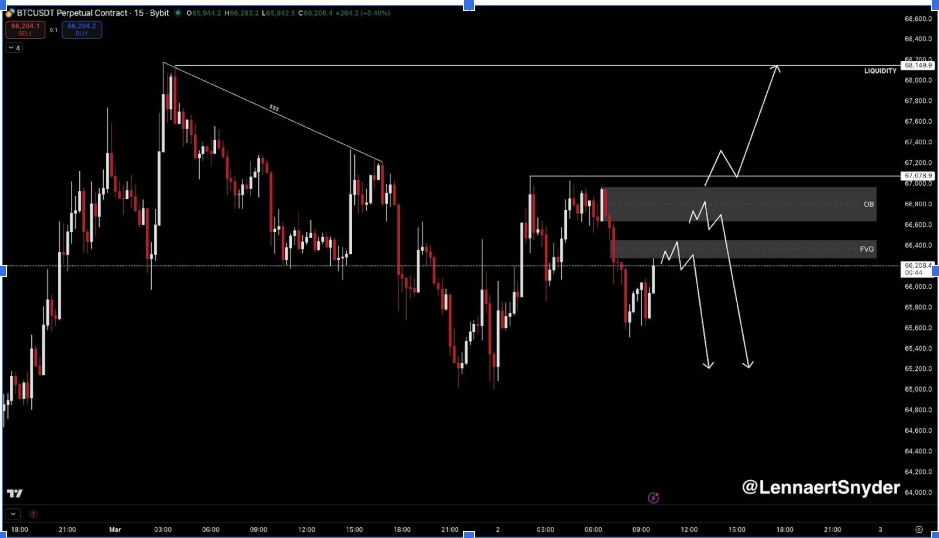
The plan looked for shorts after a bearish market structure break. It referenced a zone near the $66,360 fair value gap and $66,800 order block. Those areas were drawn in as stacked gray bands above the current price on the chart.
Snyder also marked a bullish invalidation line. The post said taking out the $67,078 high could signal a compression breakout. It then charted a run-up towards $68,150 liquidity as a follow-on target.
The chart reveals the price oscillating below the gray resistance area. It also outlines two potential paths: going into liquidity above, or rejection and a drop. That framing suits a market where direction is unsettled.
Liquidity Zones Build Near $67,482 and $68,150
Meanwhile, Ali Charts shared a Bitcoin liquidations map which highlighted a key level near 67,482. The post said a jump to $67,482 could liquidate about $20.5 million in BTC short positions. The heatmap also revealed brighter bands overhead, indicating thicker liquidity overhead.
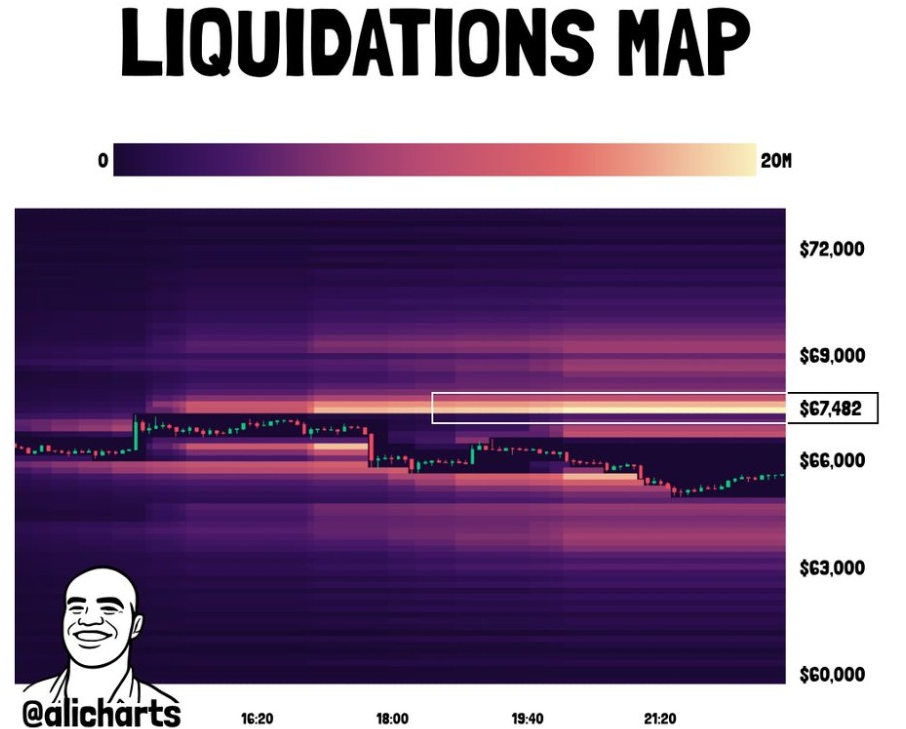
In such maps, brighter areas tend to cluster with leverage. If price pushes into that region, forced covering can speed things up. That is why traders pay attention to liquidation bands within tight ranges.
The same $67K area is also overlapping Snyder’s breakout trigger and liquidity target. This convergence adds weight to the level. However, liquidity magnets work both ways, and price can also reverse at them.
Furthermore, Ali Charts also posted the separate ETF net flows graphic. It saw BTC ETF flows go positive during the last week of February. The chart showed a +11.8K net number following 3 weekly negatives of -6.35K, -5.30K, and -4.58K.




