Wisp
Wisp Doge Pepe
 Zylo Ecosystem
 Crawlerpad
 Pudgy Penguins
 Pearl
Pearl Basic Attention

Ethereum price is currently sitting at a key technical zone following a fresh rebound towards the $2,000 area. Several analysts now view this region as being important for the next direction move. Together, their charts suggest a balancing of short-term resistance against longer-term accumulation signals of a market.
Ethereum Price Faces Resistance on 4-Hour Chart
Ethereum price is again flashing a TD Sequential sell signal on the 4-hour chart, according to Ali Charts. His latest setup showed another “9” signal near the recent local high around the $2,060 zone. That matters because similar signals in recent weeks preceded notable pullbacks.
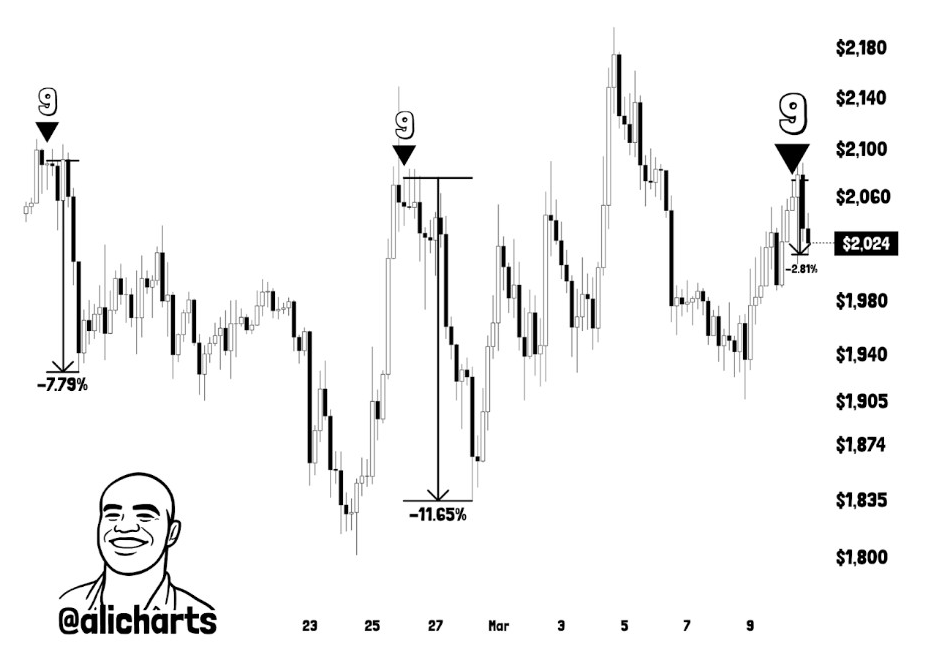
The chart also shows that previous sell signals led to drops of about 7.79% and 11.65%. This time, the downside projection on the chart is smaller, around 2.81% towards the $2,024 area. Even so, the setup suggests Ethereum price might be approaching another short-term exhaustion point rather than a clean breakout.
Long-Term Accumulation Structure Holds
Moreover, Javon Marks took a broader view, arguing that Ethereum is still in a major accumulation phase. His chart compares the current structure with previous cycles, moving from accumulation to strong markup periods.
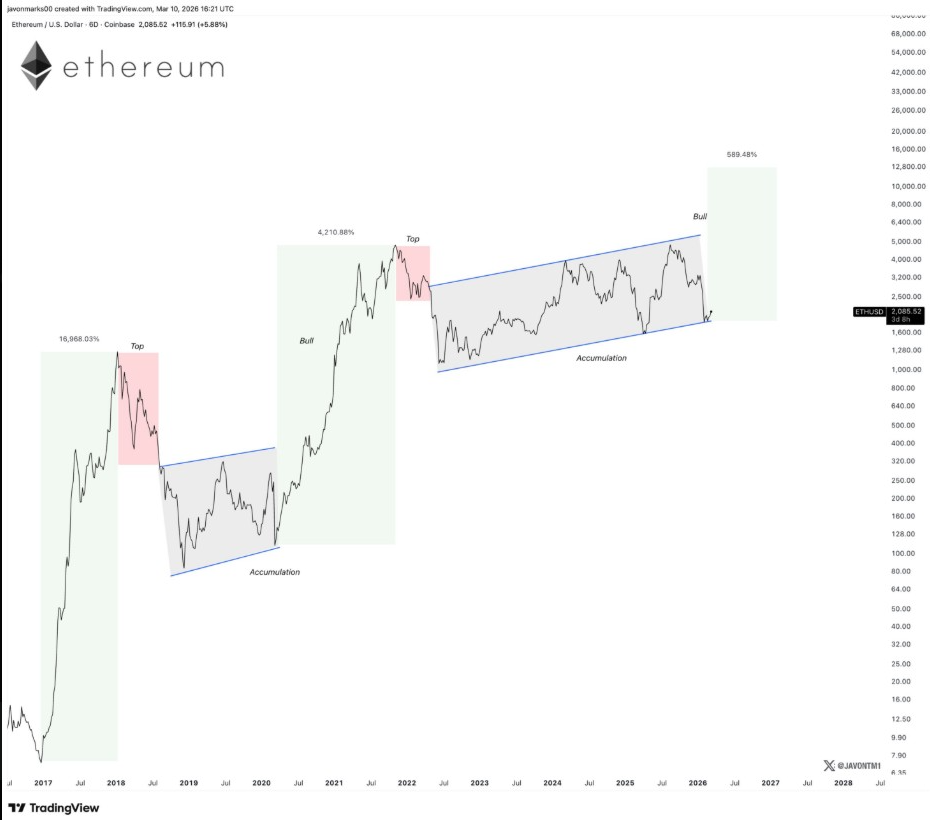
The targets attached to that view are well above the current market. Marks pointed to potential goals at $5,000, $8,557, and even $12,000 or more. While those levels are clearly long-term projections, the core idea is that Ethereum price may be completing a broad consolidation channel ahead of the next bigger expansion beginning.
ETH/BTC Rotation Signal Indicates Relative Strength
Meanwhile, Bitcoinsensus shifts the focus from the dollar chart to ETH versus Bitcoin. Its ETH/BTC setup uses a Wyckoff-type cycle and argues that the distribution has already played out, with a markdown following. Now, the pair is back inside what the chart is describing as an accumulation and oversold region.
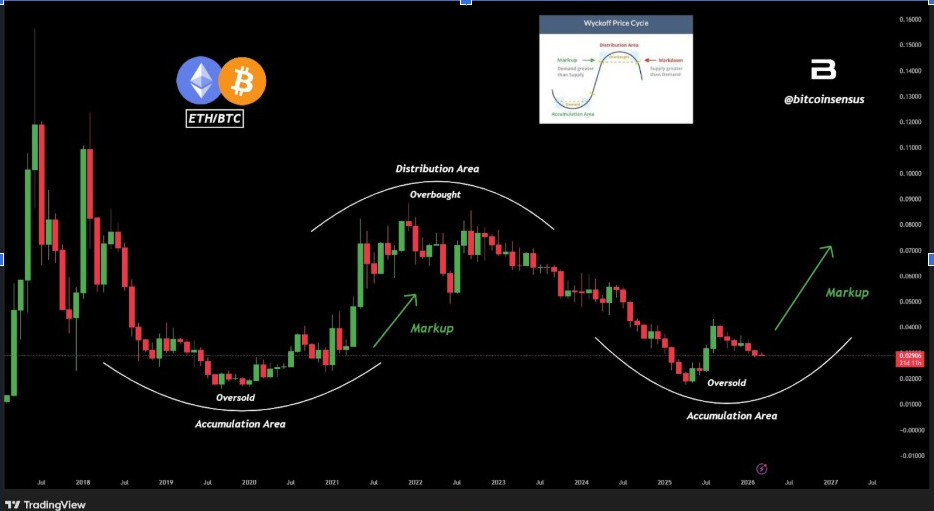
That’s important because ETH/BTC is often used as a gauge for whether Ethereum is regaining leadership in the crypto market. The chart suggests that if the structure improves here, Ethereum may begin recovering relative strength against Bitcoin. In turn, that would support the bigger case that Ethereum price is moving out of a weak phase and into a stronger rotation time period.
ETH Recovery Depends on Holding the Current Manipulation Wick
Alien OPS is focused on the weekly chart and shows the current area as a manipulation wick which must hold into candle close. His structure shows Ethereum sweeping lower, and then rebounding from around the $2,000 zone. From there, the chart draws a line towards the $3,000 area, being the next major upside target.
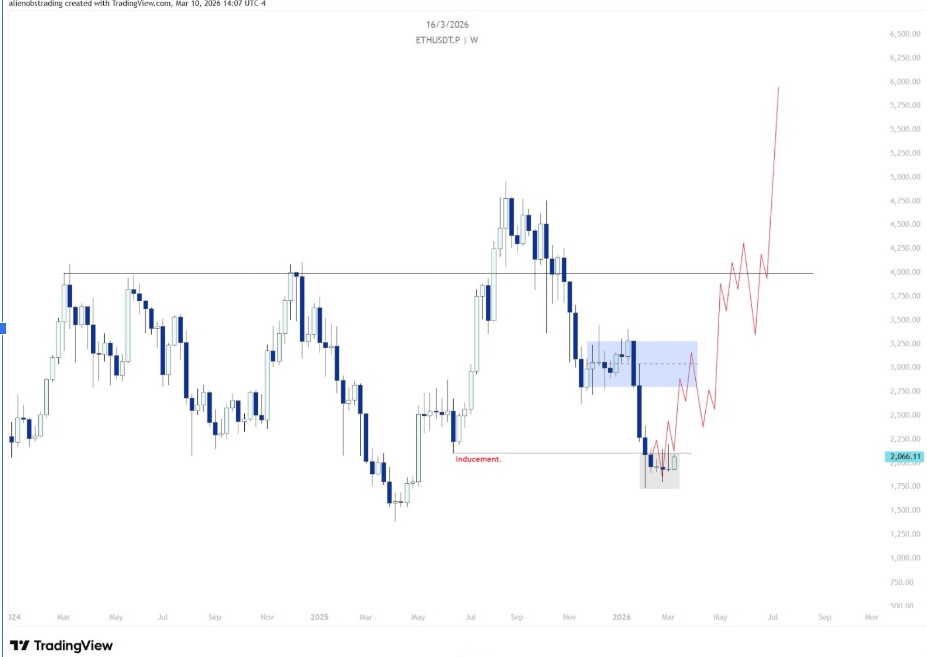
However, there is no call for a straight move higher without interruption in the setup. Instead, Alien OPS presents a move towards $3,000, followed by a retrace, and then a stronger move upwards that may ultimately challenge all-time highs. That makes his view important because it links to the broader continuation pattern with short-term support defense.
The chart also shows a prior supply area around the low $3000 range, which is now the first major overhead test. While the weekly rebound path appears bullish, it still hinges on Ethereum price holding the recent low zone and showing strength into the weekly close.