
 Puffer
 Bitcoin
 ZKsync
 NEAR Protocol
 Walrus
 Pearl
Pearl Ondo
Ondo

Shiba Inu has moved above a long-standing descending resistance line after weeks of failed attempts. The breakout came as renewed buying pressure pushed SHIB higher, improving the near-term technical setup. At the same time, exchange outflows, stronger trading activity, and a longer-term accumulation view have bolstered the bullish case.
SHIB Price Breakout Ends Weeks of Pressure
Shiba Inu had remained pinned below a falling supply trendline for more than a month. That resistance line began forming after SHIB hit an intraday high of $0.00000725 on Feb. 14. Since then, each rebound into the trendline had met selling pressure.
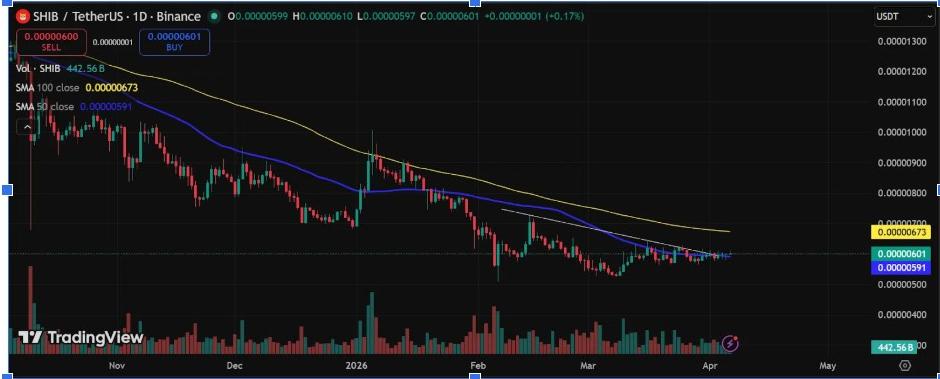
The market tested that descending barrier again on March 16 and March 25. Those rallies reached about $0.00000644 and $0.00000628, but both stalled under the same ceiling. This kept SHIB locked inside a weak short-term structure.
That changed yesterday. SHIB price recovered from an intraday low near $0.00000579 and closed around $0.00000600. More importantly, the close came above the descending trendline on the daily chart, marking the first clear break of that supply wall.
The move also pushed Shiba Inu above its 50-day moving average near $0.00000591. That provides a further strength to the breakout. If momentum holds, the next technical target sits near the 100-day moving average around $0.00000673.
Exchange Outflows Point to Holder Accumulation
On-chain data has supported the breakout. CryptoQuant data showed a 24-hour exchange netflow of -133,335,400,000 SHIB. A negative net flow means more tokens left exchanges than entered them.
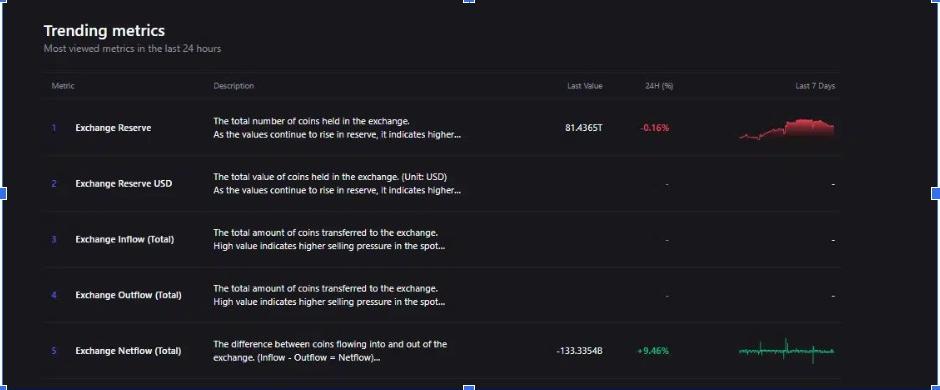
That usually suggests holders are moving coins into self-custody rather than preparing them for sale. The high outflow, in this case, decreases short-term selling pressure and helps justify the assumption that accumulation is occurring.
The shift matters because price strength without supportive flow data can fade quickly. In this case, the chart and the on-chain picture both improved. That makes the breakout more believable than a mere low-volume bounce.
Trading activity also increased. Volume increased 41% over the past 24 hours, showing that market participation improved during the move. Spot and futures taker data also leaned positive, with taker buy volume slightly ahead of taker sell volume.
Long-term Chart Still Frames this as an Accumulation Phase
Another long-term chart, Vuori Trading shares, provided a wider perspective. In that setup, SHIB price is still holding a floor that the analyst first tracked last summer. The chart identified the recent structure as an accumulation phase after prior crash and retrace periods.
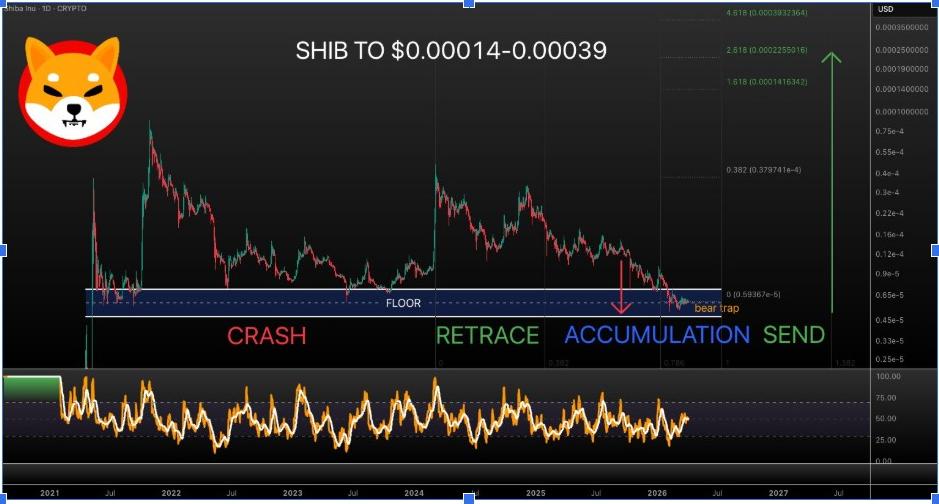
The same view suggests downside risk has narrowed near this floor zone. It also puts the most recent weakness into perspective as a potential bear trap instead of the beginning of another collapse. In that reading, the market is attempting to establish a base before a larger directional move.
Vuori Trading projected a much wider upside path if the floor keeps holding. The chart mapped potential targets between $0.00014 and $0.00039 over a later expansion phase. Those levels remain well above current prices, suggesting a long-term bullish scenario rather than an immediate target.
That outlook does not cancel near-term volatility. Still, it aligns with the idea that SHIB may be in a late-stage accumulation phase. The recent breakout beyond the downward trendline supports that possibility.
For now, the first task for bulls is to defend the breakout. If SHIB price slips back below the former descending resistance and the 50-day average, the move could lose force. However, if buyers keep control, the market may try to challenge the next resistance around the 100-day moving average.


