
 Doge Pepe
 Bitway
 Optimism
 Pearl
Pearl Pons
Pons Quantus
 Starknet

Dogecoin price has dropped toward $0.074 after another difficult week pushed the meme coin close to its lowest levels of the current cycle. The decline has left most holders underwater, although several charts now show the price approaching areas that previously attracted buyers.
A daily reversal indicator has also appeared near the latest low. That signal gives DOGE crypto a possible short-term recovery path, but the market still needs to defend $0.073 and reclaim $0.081 before the structure shows clear improvement.
Dogecoin Price Flashes a Daily Buy Signal
Ali Martinez highlighted a TD Sequential buy signal on Dogecoin’s daily chart after a sequence of bearish candles carried the price toward $0.077. The setup appeared as the indicator completed a nine-count near the recent low.
The chart places $0.073 as the level that must be held for the recovery attempt to remain active. DOGE crypto traded close to $0.0744 in the latest snapshot, leaving little distance between the market and that support.
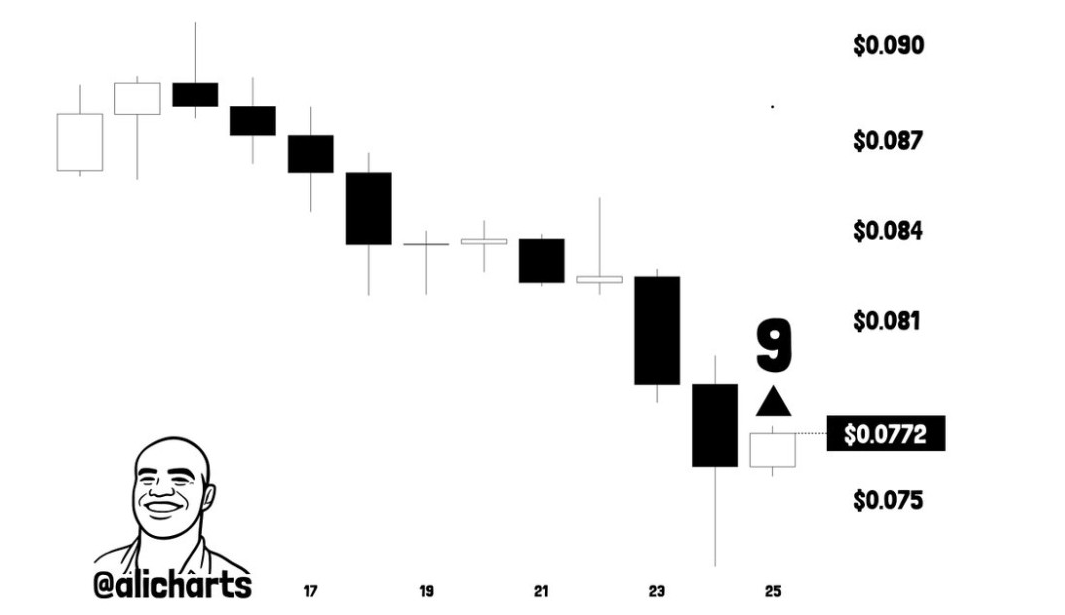
A rebound above $0.077 would place $0.081 back in focus. That level acted as support earlier in the decline and may now become the first resistance area.
Stronger barriers appear near $0.084 and $0.087. Recovering those levels would help DOGE form a higher high on the daily chart after several sessions of falling prices.
The buy signal does not confirm a bottom on its own. A close below $0.073 would weaken the setup and leave the market without clear nearby support until the lower long-term zone.
Holder Losses Reach an Extreme Level
Meanwhile, Cryptollica pointed to an on-chain chart showing that only about 17% of Dogecoin’s supply remains in profit. The seven-day moving average has fallen toward its lowest reading in several years.
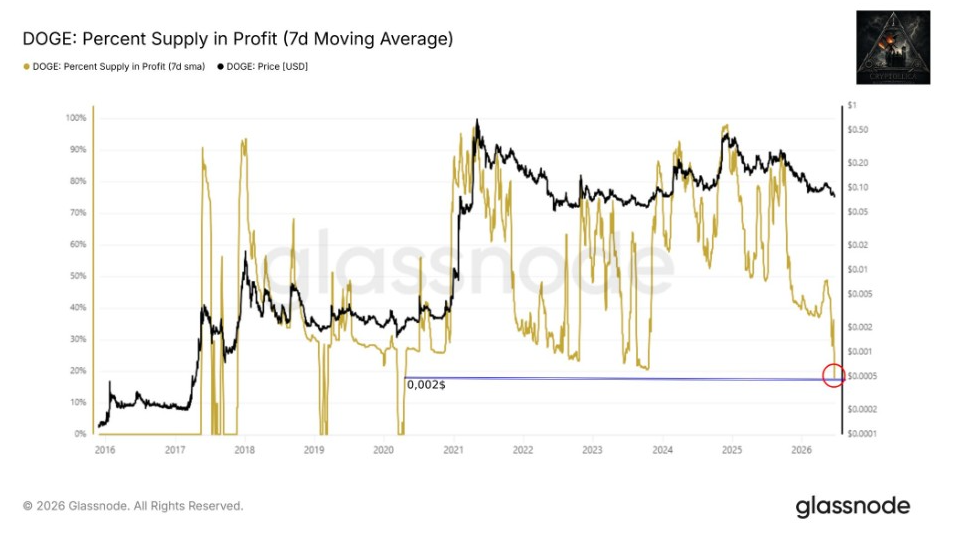
The last comparable area shown on the chart appeared around April 2020, shortly after the broad market collapse. DOGE crypto traded near $0.002 at that time before entering a much larger expansion in the following cycle.
A low percentage of supply in profit means most coins were acquired above the current market price. This often reflects widespread unrealized losses and weak holder sentiment.
Such readings can appear near periods of market stress, but they do not guarantee an immediate reversal. Assets may remain depressed while holders sell into rebounds or wait for stronger demand.
The data, therefore, shows that Dogecoin has reached an unusually painful point for investors. Price action still needs to confirm whether that pressure is producing capitulation or simply extending the decline.
Historical Support Sits Near $0.05–$0.06
Additionally, Celal Kucuker identified the $0.05–$0.06 range as Dogecoin’s main historical support area. His weekly chart showed price approaching a base that held during repeated tests in 2022 and 2023.
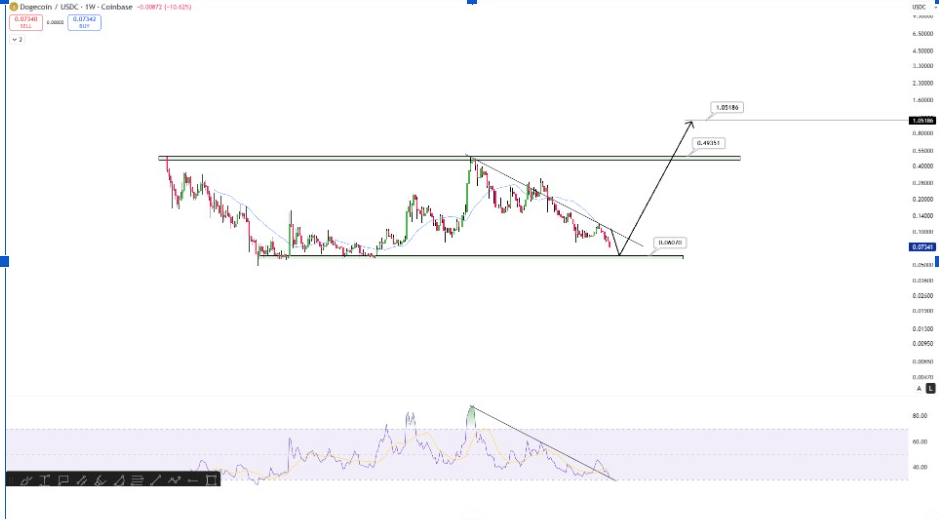
The chart marks approximately $0.0607 as a possible lower target before a broader recovery. DOGE crypto currently trades above that level, but the descending weekly structure leaves another support test possible.
The Relative Strength Index is also moving near oversold territory. Momentum has weakened alongside price, although the indicator has not yet produced a confirmed bullish reversal.
A recovery from the historical floor could initially target the previous cycle resistance around $0.49. The chart later projects a move toward $1.05 in a future bull market.
Those higher figures remain long-term scenarios rather than immediate targets. DOGE crypto must first hold the lower range and break the descending trend line before a larger recovery becomes credible.
Weekly Structure Leaves Two Clear Scenarios
Notably, Mikybull Crypto also expects Dogecoin price to test a long-standing demand zone before any major rally. His weekly chart places the lower boundary close to $0.06, matching the support highlighted in the wider historical analysis.
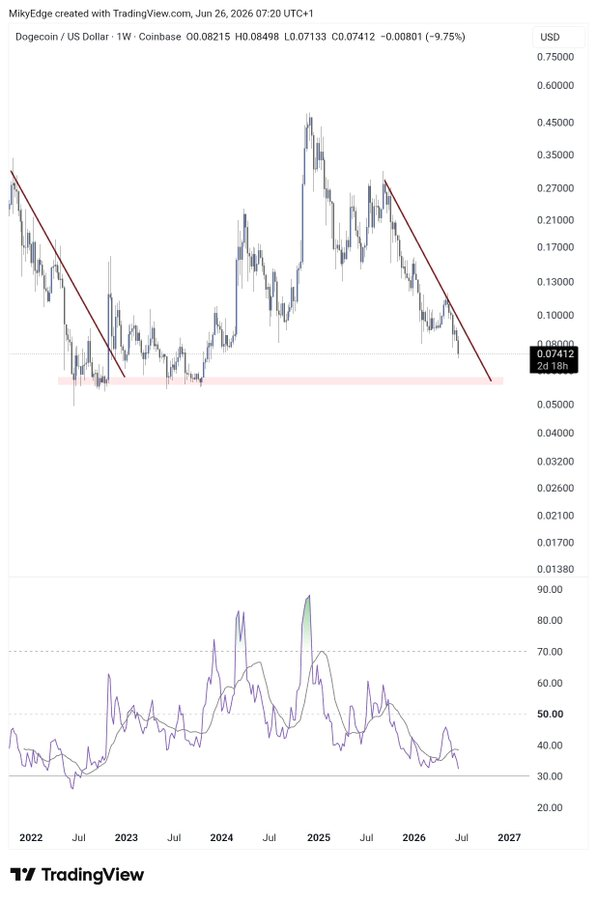
DOGE has followed a descending resistance line from its 2025 high and now trades near the bottom of that structure. Weekly momentum also sits close to 30, showing that selling has pushed the market toward oversold conditions.
The first scenario begins with support holding between $0.06 and $0.073. Under that setup, DOGE could rebound toward $0.081, then $0.10, and then the falling trend line above it.
The second scenario starts with a weekly close below $0.06. Such a move would break the multi-year support area and weaken the projected recovery toward the previous cycle highs.




