
 Doge Pepe
 Optimism
 Pearl
Pearl Quantus
 Bitway
 Pons
Pons NEAR Protocol

- Key Insights:
- Dogecoin price is testing whether the 2026 cycle can mirror earlier multi-year expansion phases.
- The $0.081-$0.089 zone is the first short-term resistance band to clear.
- Notably, the $0.07-$0.05 region is still viewed by some traders as a long accumulation zone.
Dogecoin price traded near long-term support as analysts compared the current structure with earlier expansion phases. DOGE recently swept lower levels before recovering toward resistance, but the broader cycle thesis remains unconfirmed.
Trader Tardigrade linked the setup to earlier rallies in 2017 and 2020. Shorter-term charts, meanwhile, placed the first resistance test near $0.081–$0.090.
Dogecoin Price Tests the 2026 Cycle Setup
Dogecoin price is trading near $0.077 after recovering from a recent sweep of lower levels. The monthly structure shared by Trader Tardigrade showed DOGE reacting around a long-term rising trendline that previously preceded major expansion phases.
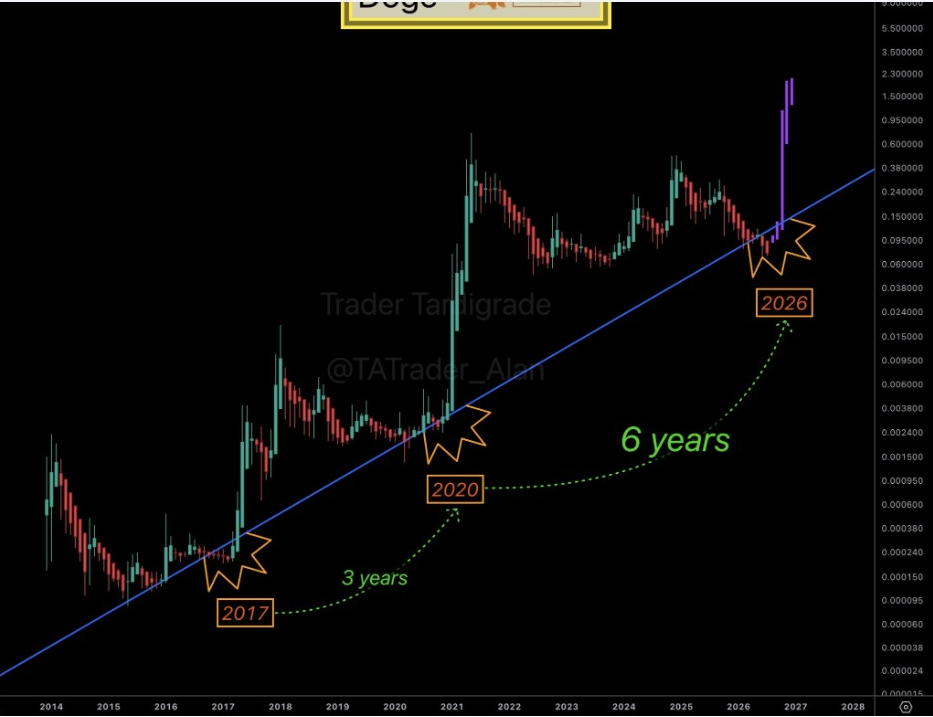
According to the analyst, Dogecoin produced its first major pump in 2017, followed by another in 2020. The gap between those moves was roughly three years. The current setup places the next cycle in 2026, six years after the 2020 rally.
Trader Tardigrade argues that the cycle is expanding rather than disappearing. In his view, DOGE crypto may now be entering the next major window after years of compression. The chart shows price reacting near the long-term support line before a projected vertical move toward higher levels.
This view has drawn attention as DOGE crypt has already swept the lows and returned to a key trend zone. A monthly close above the rising line would strengthen the case that the market is forming a cycle base.
DOGE Crypto Short-Term Resistance Starts Near $0.081
More Crypto Online sees Dogecoin moving toward its first resistance zone in what he labels wave four. His four-hour chart placed the near-term resistance band between $0.0814 and $0.0897.
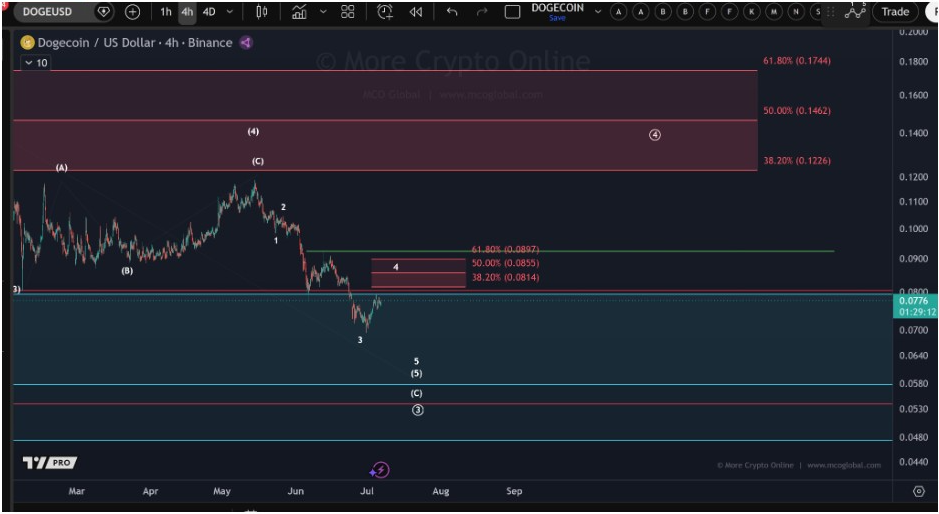
That range matters as DOGE crypto is currently trading just below it. A push into the band would test whether the recent rebound has enough strength to develop beyond a relief move. The same chart marks higher Fibonacci levels at $0.1226, $0.1462, and $0.1744.
Low Sweep Fuels Reversal Speculation
Additionally, Hailey LUNC XRP noted that DOGE price recently swept the lows before pushing back into a multi-year downtrend. The weekly chart shows price dipping below a prior support area, then rebounding sharply toward a descending trendline.
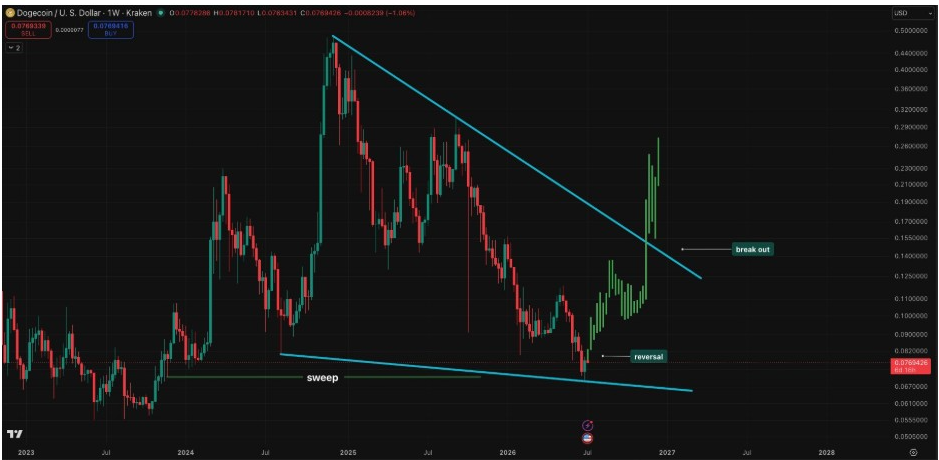
That type of move often attracts traders because it can signal a failed breakdown. In simple terms, sellers pushed DOGE below support, but buyers absorbed the move.
The chart marks the lower area as a “sweep” and the rebound as a possible “reversal.” It also shows the next major test sitting at the descending trendline from the previous cycle high.
A break above that line would change the tone of the chart. It suggests DOGE has broken out of part of its long downtrend and may be preparing for a larger recovery.
Still, the level has not fully broken yet. Until it does, DOGE is trading inside a recovery attempt rather than a confirmed bullish continuation.
Accumulation Zone Stretches From $0.07 to $0.05
Notably, polaris_xbt is watching a wider accumulation range rather than chasing the immediate breakout. The analyst said he is setting limit orders from $0.07 to $0.05, calling the setup an easy 5x opportunity in the next cycle.
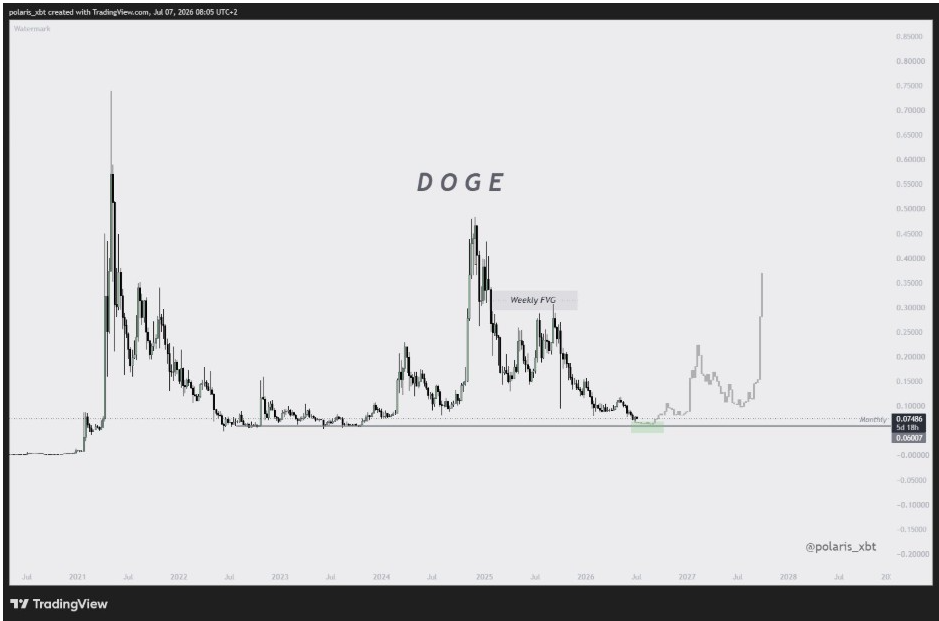
His chart showed DOGE trading near a monthly support level at $0.0607, with the price hovering just above it. It also highlights a possible weekly fair-value gap at higher levels, suggesting DOGE may revisit liquidity above its current range if momentum improves.




