Wisp
Wisp Doge Pepe
 Crawlerpad
 Zylo Ecosystem
 Pearl
Pearl Basic Attention
 Quantus
XRP price is back in a familiar technical zone, and traders are paying attention. The token trades near $1.10 as analysts compare its current structure with earlier cycle patterns that appeared before major expansion phases.
The setup now brings together price compression, whale accumulation, and stronger withdrawal activity across exchanges. While XRP has not yet confirmed a breakout, analysts say the current range could decide whether the next move turns into a wider recovery or another failed attempt.
XRP Price Macro Pattern Draws Breakout Attention
XRP price long-term chart is gaining attention after market analyst ChartNerd compared the current structure with earlier cycle formations. The analyst said XRP crypto often moves through corrective wedges and triangle patterns before larger expansion phases begin.
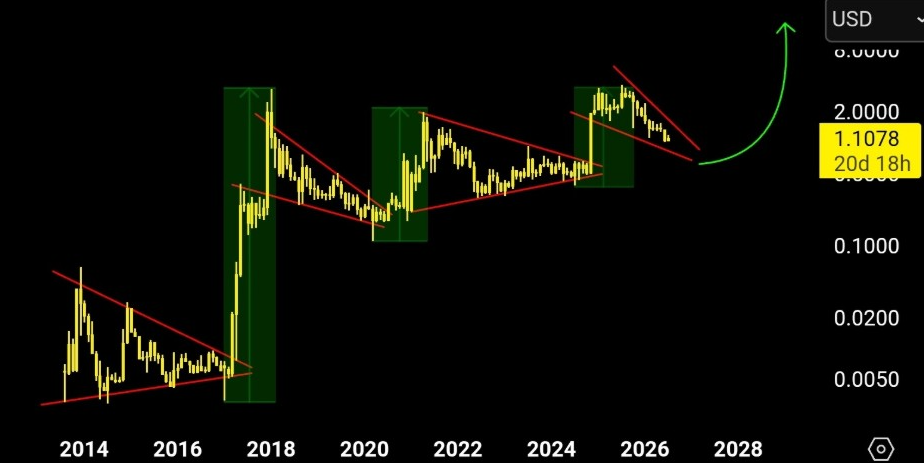
The chart showed several historical compression zones, including the 2014–2017 base, the 2020–2021 setup, and the current 2025–2026 structure. Each phase includes a strong rally, a long correction, and a narrowing range before a stronger move develops.
ChartNerd argued that XRP price is now more than 70% below its major cycle high. That places the token in a zone that has previously appeared before wider market moves. The current structure still needs confirmation, as price must break above the upper boundary of the range to shift momentum.
Ripple Whale Accumulation Adds Weight to the Setup
Meanwhile, Ali Charts added another bullish signal, noting that whales bought 70 million XRP over the past week. The whale holdings chart showed balances rising from around 3.75 billion XRP toward the 3.83 billion zone before a slight pullback.
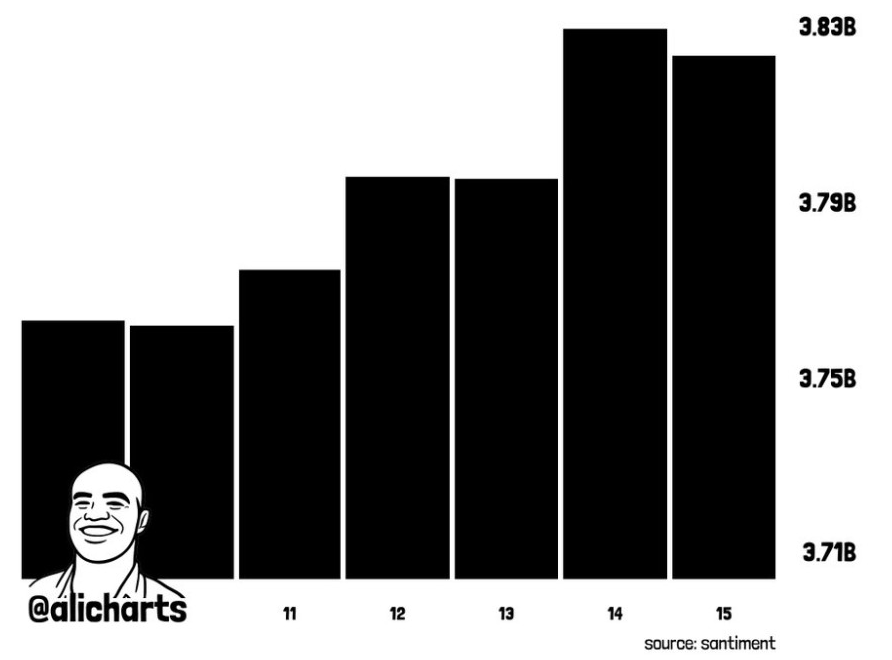
That accumulation matters as large wallets often build positions before price momentum becomes clear. XRP has not yet turned that buying into a strong breakout, but whale demand suggests bigger holders are not exiting aggressively at current levels.
At the same time, XRP price remains near $1.10 inside a broader consolidation range. A stronger move above the current compression area would improve the bullish setup and could attract more trend-following demand. Until then, the market remains focused on whether whale accumulation can support a cleaner technical shift.
XRP Exchange Withdrawals Show Supply Shift
Additionally, on-chain activity showed a broader shift toward withdrawal-dominant XRP transactions across major platforms. Amr Taha’s CryptoQuant-based data showed Coinbase’s seven-day net depositing and withdrawing transaction count falling to about -13,000 on July 15.
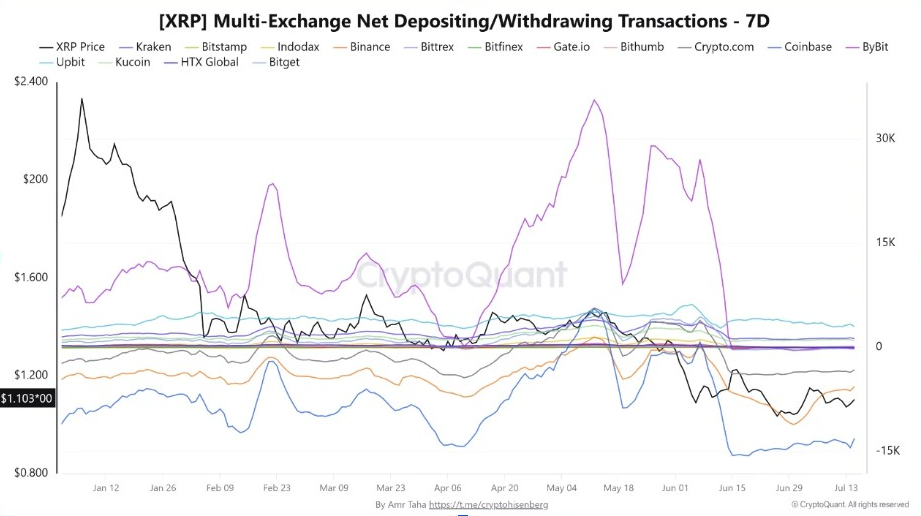
That reading is around 700 transactions below the -12,300 level recorded on February 14. Binance also moved into negative territory near -5,600 transactions, close to levels last seen on February 11. The data suggests withdrawals are taking a larger share of exchange activity.
Bybit showed the sharpest reversal as its metric moved from about +27,000 depositing transactions on June 7 to -220 on July 15. That marks a swing of roughly 27,220 transactions in 38 days, suggesting the earlier deposit-heavy phase has faded.
Withdrawal-dominant activity does not confirm where the tokens are going. The metric tracks transaction counts rather than the dollar value of XRP transfers. Still, simultaneous negative readings across Coinbase, Binance, and Bybit point to a stronger shift away from deposit-led activity.
However, XRP crypto still needs price confirmation, especially as the token trades below its larger breakout levels. Therefore, the combination of whale buying and withdrawal-heavy exchange activity gives bulls more data to support the accumulation argument.
Analyst Highlighted Next Key XRP Price Target
Notably, crypto trader Don’s XRP/USD chart showed price moving inside a declining channel. The lower trendline is acting as support, while the upper structure continues to limit upside momentum.
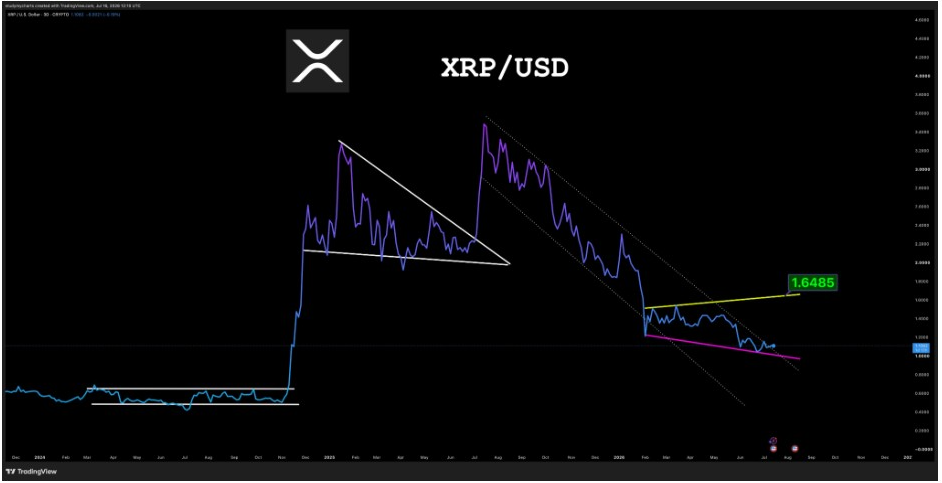
His chart pointed to a possible breakout path toward $1.6485 if XRP price escapes the current compression. That target fits with the bullish view from analysts tracking whale accumulation, exchange withdrawals, and macro wedge behavior.
This article is for informational purposes only and does not constitute financial or investment advice. Cryptocurrency prices, on-chain metrics and technical indicators can change rapidly. Readers should conduct independent research before making investment decisions.
The key trigger is a breakout above the descending structure, followed by a successful retest. If XRP price confirms that move, the $1.6485 zone becomes the first major upside level to watch before broader cycle targets enter focus.