
 Pearl
Pearl Zylo Ecosystem
 Bitway
 Derive
 Walrus
 Quantus
 Pudgy Penguins

Solana price traded near $73.50 after buyers defended a sharp decline at the start of August.
However, the wider structure continued to favor sellers as SOL formed lower highs across several time frames.
The next move depends on a narrow range between $70 support and $73.76 resistance. A confirmed breakout could support a recovery toward $78, while a breakdown may expose the $65 region.
Solana Price Tests a Critical Range
Solana price traded near $73.50 after recovering from a brief move below $71. The four-hour chart still placed SOL beneath descending resistance. CryptoOzee identified $73.76 as the first trendline test and a possible rejection area.
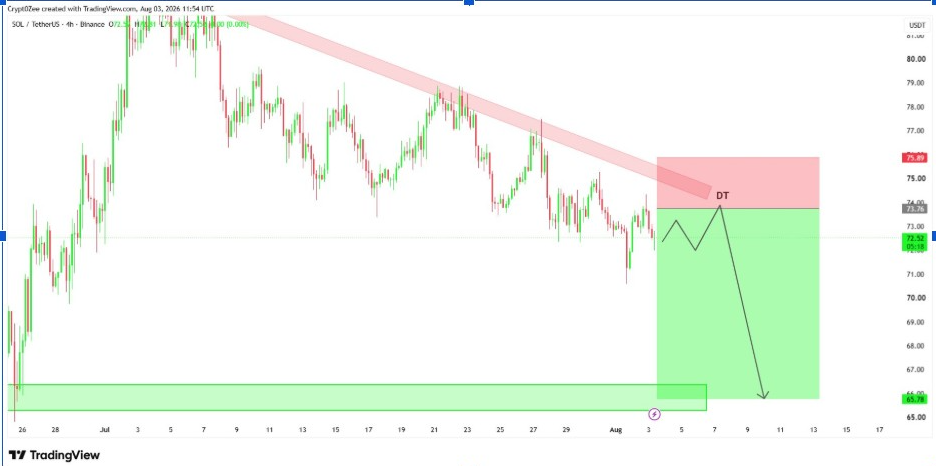
The chart projected a short-term recovery into trendline resistance before another possible decline.
Under that scenario, sellers could push SOL toward the demand zone near $65.70.
However, the bearish setup would weaken above $75.89. A sustained move beyond that level would clear immediate resistance and improve the short-term structure.
SOL crypto had formed lower highs since trading above $83 in early July.
Each recovery stalled below the previous swing high. The $73.76 level therefore represented the first major test before resistance between $75 and $76.
Historical market data showed that SOL traded above $82 during early July before falling below $74 later in the month.
Failure to reclaim the descending trendline would keep sellers in control.
It would also leave $70 as the final nearby support before a deeper decline. A four-hour close above $75.89 would challenge that outlook.
SOL Crypto Weekly Structure Exposes Lower Demand
Meanwhile, the weekly chart places Solana price inside a broad historical demand area. Crypto analyst Fella identified the current zone between roughly $70 and $84. This support band has slowed the decline, although buyers have not produced a decisive reversal. Fella noted SOL trades about 75% below its all-time high.
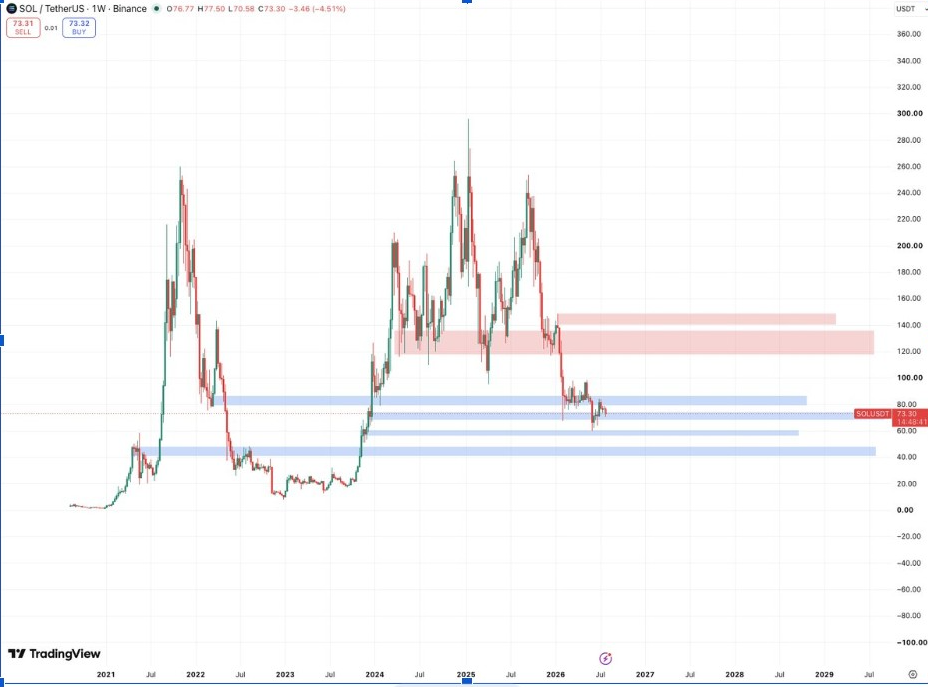
Solana price now sits near the lower portion of that range. Another demand zone appears between $58 and $65, closely matching the shorter-term target around $65.70. A deeper weekly support area sits near $40 to $50, where SOL price recorded strong reactions during earlier cycles.
On the upside, major weekly supply begins near $120. A second resistance band appears around $138 to $145. Those levels sit far away while SOL trades below $80, leaving $70 as the more urgent market threshold.
Short-Term Reversal Needs Confirmation
Additionally, market analyst Crypto Tony is waiting for another test of $70 before considering an entry. His one-hour chart keeps SOL crypto under a falling trendline connecting several lower highs. That line now approaches the $75 area after starting near the early July peak around $84.
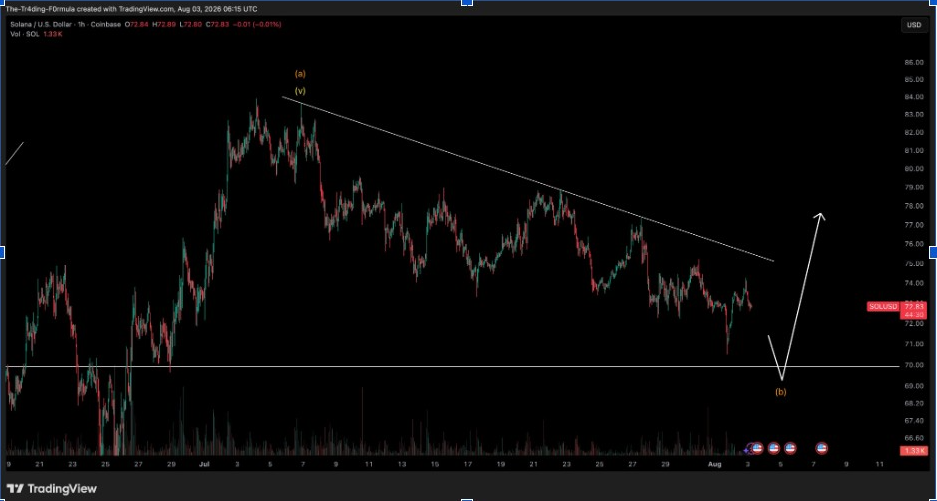
The preferred scenario shows SOL dipping toward support between $69 and $70. Price then rebounds toward $77 or $78 after buyers step into the market. This setup requires a strong reaction near support and a confirmed break above the descending trendline.
A clean move below $69 would weaken the rebound case. Sellers could then push prices toward the next demand area near $65. The candle structure around $70 may provide the clearest signal, especially if trading volume rises during the test.
Solana Price Breakout Could Open the Path to $78
Notably, BitGuru also identifies the area around $70 as a possible reversal zone. His four-hour chart marks key support near $70.08. The projected path shows Solana price stabilizing between $70 and $73 before turning higher.
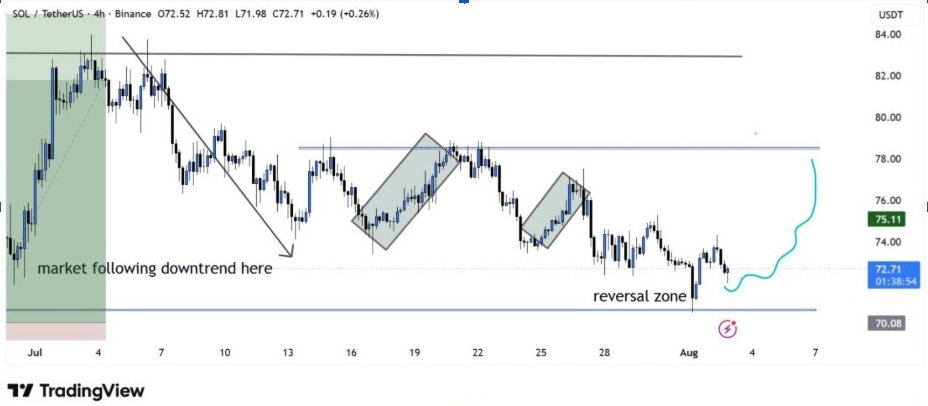
The first obstacle appears near $75, where the falling trendline may attract fresh selling. A break above that level would place $78 resistance in focus. BitGuru marks the wider horizontal barrier around $78.50.
Solana price followed a clear pattern of lower highs and lower lows throughout July. Several brief rebounds failed beneath nearby resistance. That structure only improves when buyers reclaim a previous swing high and hold it during a retest.
A move through $78 would offer the first stronger reversal signal. Moreover, clearing that barrier could expose the larger resistance zone near $83. That level capped price before the latest selloff and may attract profit-taking during any recovery.



