
 Pearl
Pearl Bitway
 Pudgy Penguins
 Quantus
 Walrus
 Quant
Quant Artificial Superintelligence Alliance
- The MANA crypto price rebounds from the EMA-50 on the intraday session.
- The 24-hour trading volume is at $571 million.
- MANA/BTC pair is trading positive by 7.0% at 0.00007370 BTC.
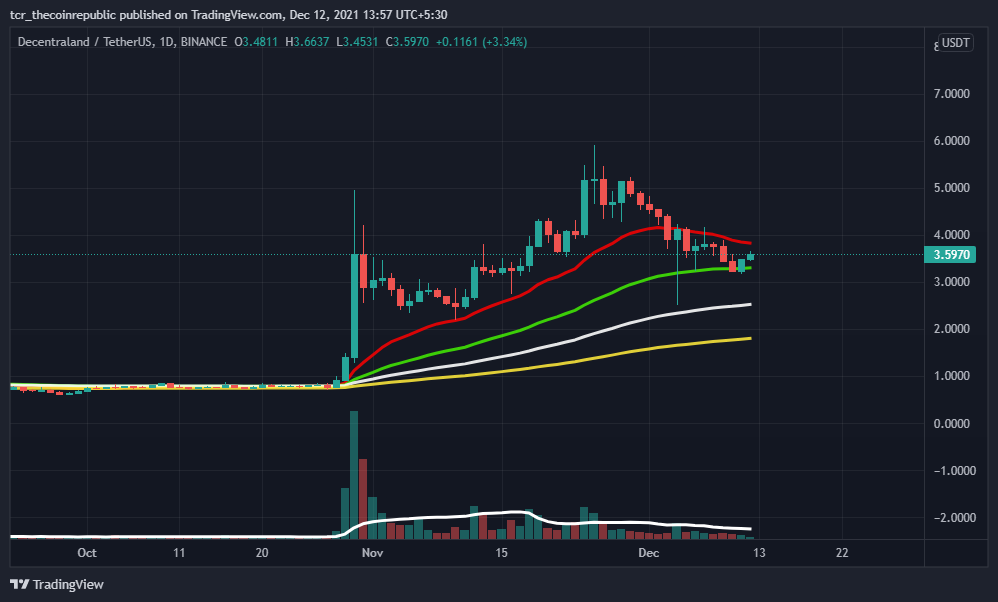
Moving Average (EMA) containing 20,50,100,200 In the MANA crypto daily price chart, it is a reliable support for currency price change. Investors can observe that price moves above the green line and can guarantee a bullish trend as long as costs are above the 200-day moving average.
The volume (21.873 M) is below the 20-day moving average (139.433 M). The volume is descending, so the cost has toiled for several days. Investors may also witness a drop in volume. This indicates that remarkable changes are hoped for in the subsequent trading days.
MANA Crypto Price Rebounds From The Support Expecting a 15% Rise For The Short Term
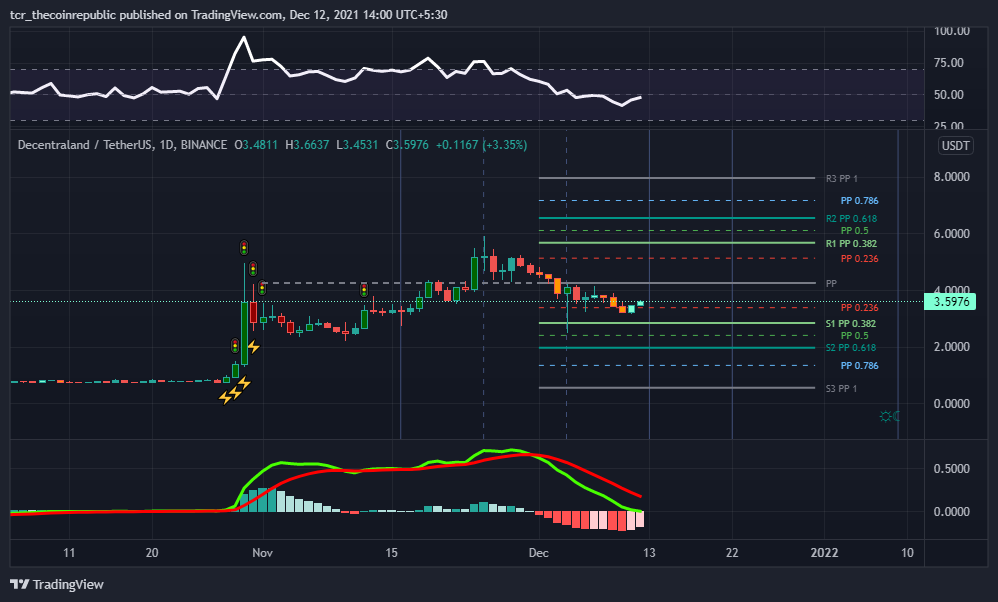
The daily price chart of the MANA crypto bounce backs from the $2.85 support zone. Relying on the price activity, the support area is within $2.85. If the price fails to hold above it, the following support to look out for is $2.0. On the flip side, the resistance level to look for is around $4.25.
The RSI showed a 47.30 (bullish) sign with a short-term buy signal. Investors may observe that the indicator’s RSI line is running upside. A rise can happen on upcoming trading days.
The MACD shows a (bearish) cross below the signal line on December 02, indicating a sell signal for the crypto. In addition, investors can see red bars in the histogram indicator.
Conclusion
Decentraland price today is $3.63 with a 24-hour trading volume of $571,565,566. MANA price has been up 8.8% in the last 24 hours. It has a circulating supply of 1.3 Billion MANA coins and a total supply of 2.19 Billion.
The RSI shows a buy, and MACD indicates a sell signal. Traders have directed low volume. In fact, the cost rebounds from the support zone. A market overview also shows that this pattern will continue to surge in the coming trading days.
Resistance Level: $4.25
Support Level: $2.85 & $2.0
DISCLAIMER
The views and opinions stated by the author, or any people named in this article, are for informational ideas only, and they do not constitute financial, investment, or other advice. Investing in or trading crypto assets comes with a risk of financial loss.



