
 Bitcoin
 Ondo
Ondo Pudgy Penguins
 Walrus
 Pons
Pons Quantus
 NEAR Protocol

Bitcoin price traded around $78,500 on Sept. 10 as investors assessed higher oil prices, rising Treasury yields and the upcoming U.S. inflation report.
BTC remained below its Sept. 3 high near $82,200 after spending most of the month inside a relatively narrow trading range.
The immediate macro focus now shifts to Friday’s Consumer Price Index release and next week’s Federal Reserve meeting.
Bitcoin Price Slips as Oil Tops $100 Before CPI
BTC price dropped to a crucial support level as crude oil prices jumped. Brent jumped to $101, while the West Texas Intermediate (WTI) moved to $97.
Oil prices jumped as the US-Iran war escalated with no end in sight. The US launched several attacks against Iranian vessels, with the latter retaliating by launching missiles towards US bases in Jordan.
At the same time, Russia and Ukraine have continued their attacks, with efforts of a deal fading. Saudi Arabia and the Houthis have continued fighting. These three events will likely lead to supply disruptions at a time when inventories in the US and other countries are falling.
Notably, in the United States, gasoline and diesel prices have continued rising. The average gasoline price has jumped to $4.22, while diesel is nearing the important milestone of $6 a gallon. These numbers indicate that US inflation will remain elevated.
A report coming on Friday is expected to show that headline and core inflation remained above the 2% milestone. The most recent data showed that the headline CPI rose to 3.4% while the core CPI rose 2.4% in July.
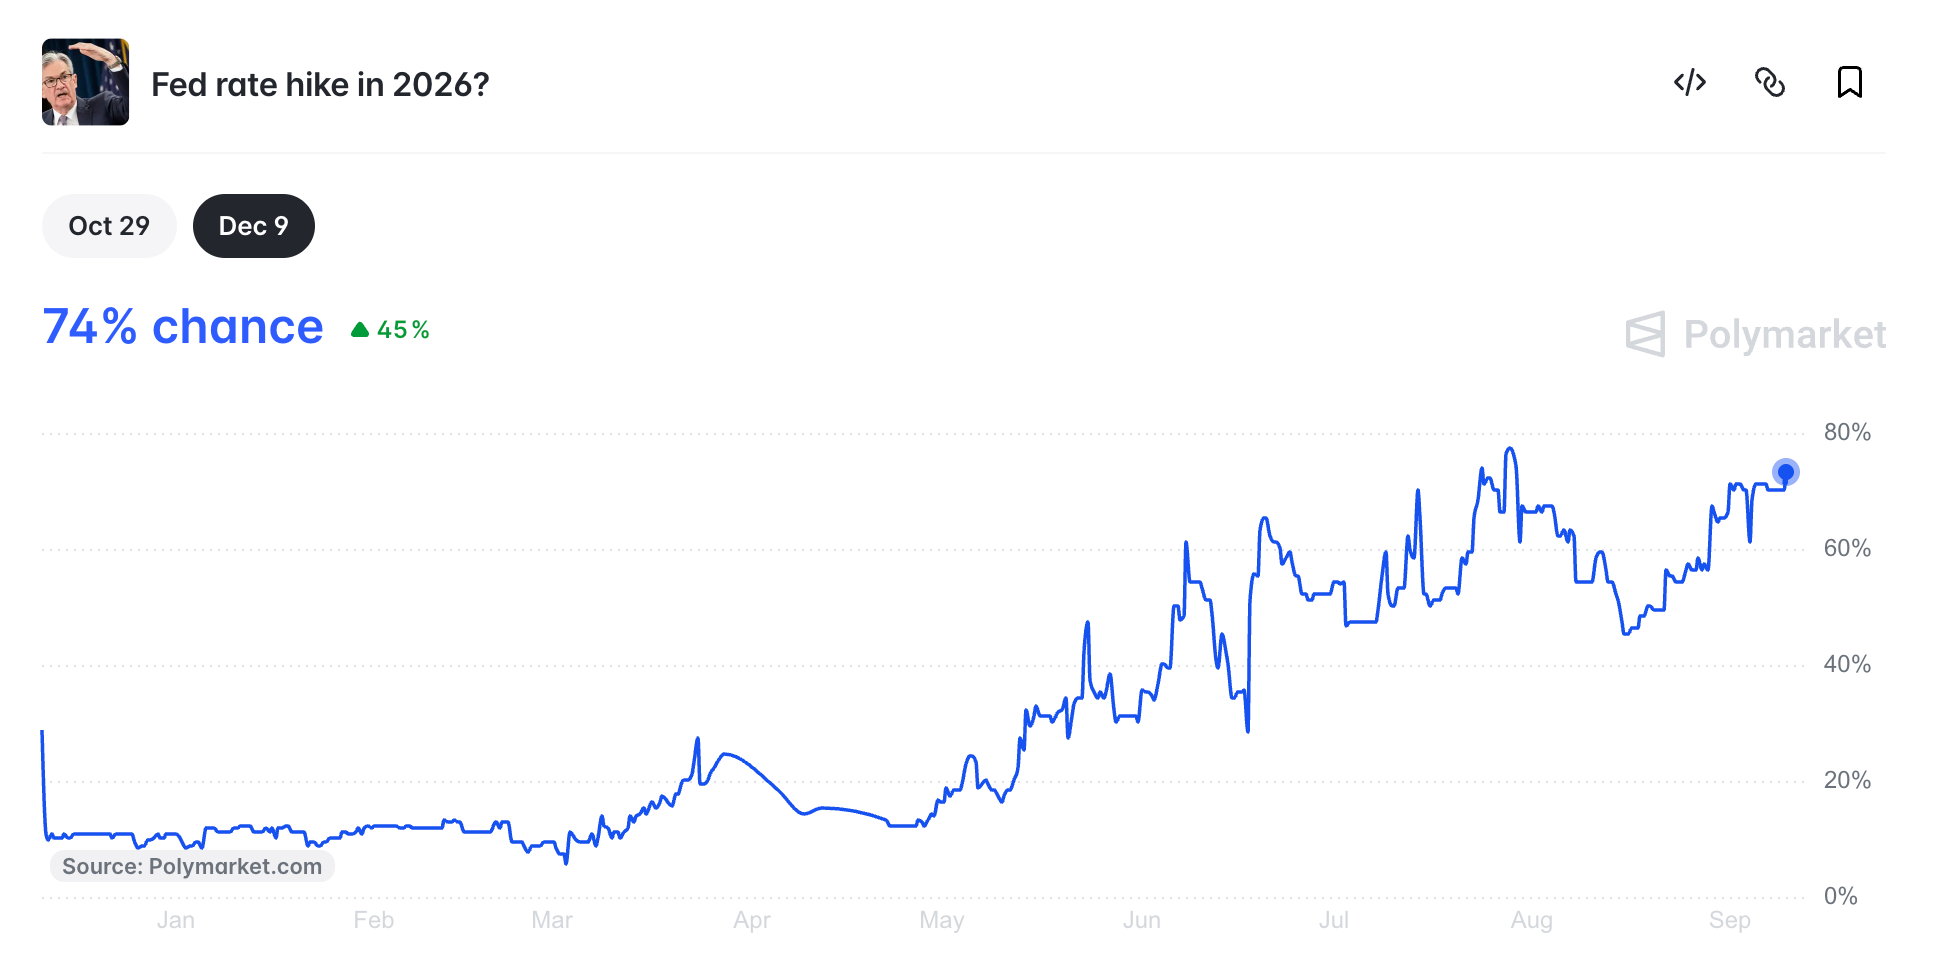
These events are crucial because of the impact of the Federal Reserve, which meets next week. As the chart below shows, traders on Polymarket are betting that the Federal Reserve will hike interest rates as soon as next week. Bitcoin often underperforms the market whenever the Fed is hiking interest rates.
US Bond Yields Have Continued Rising
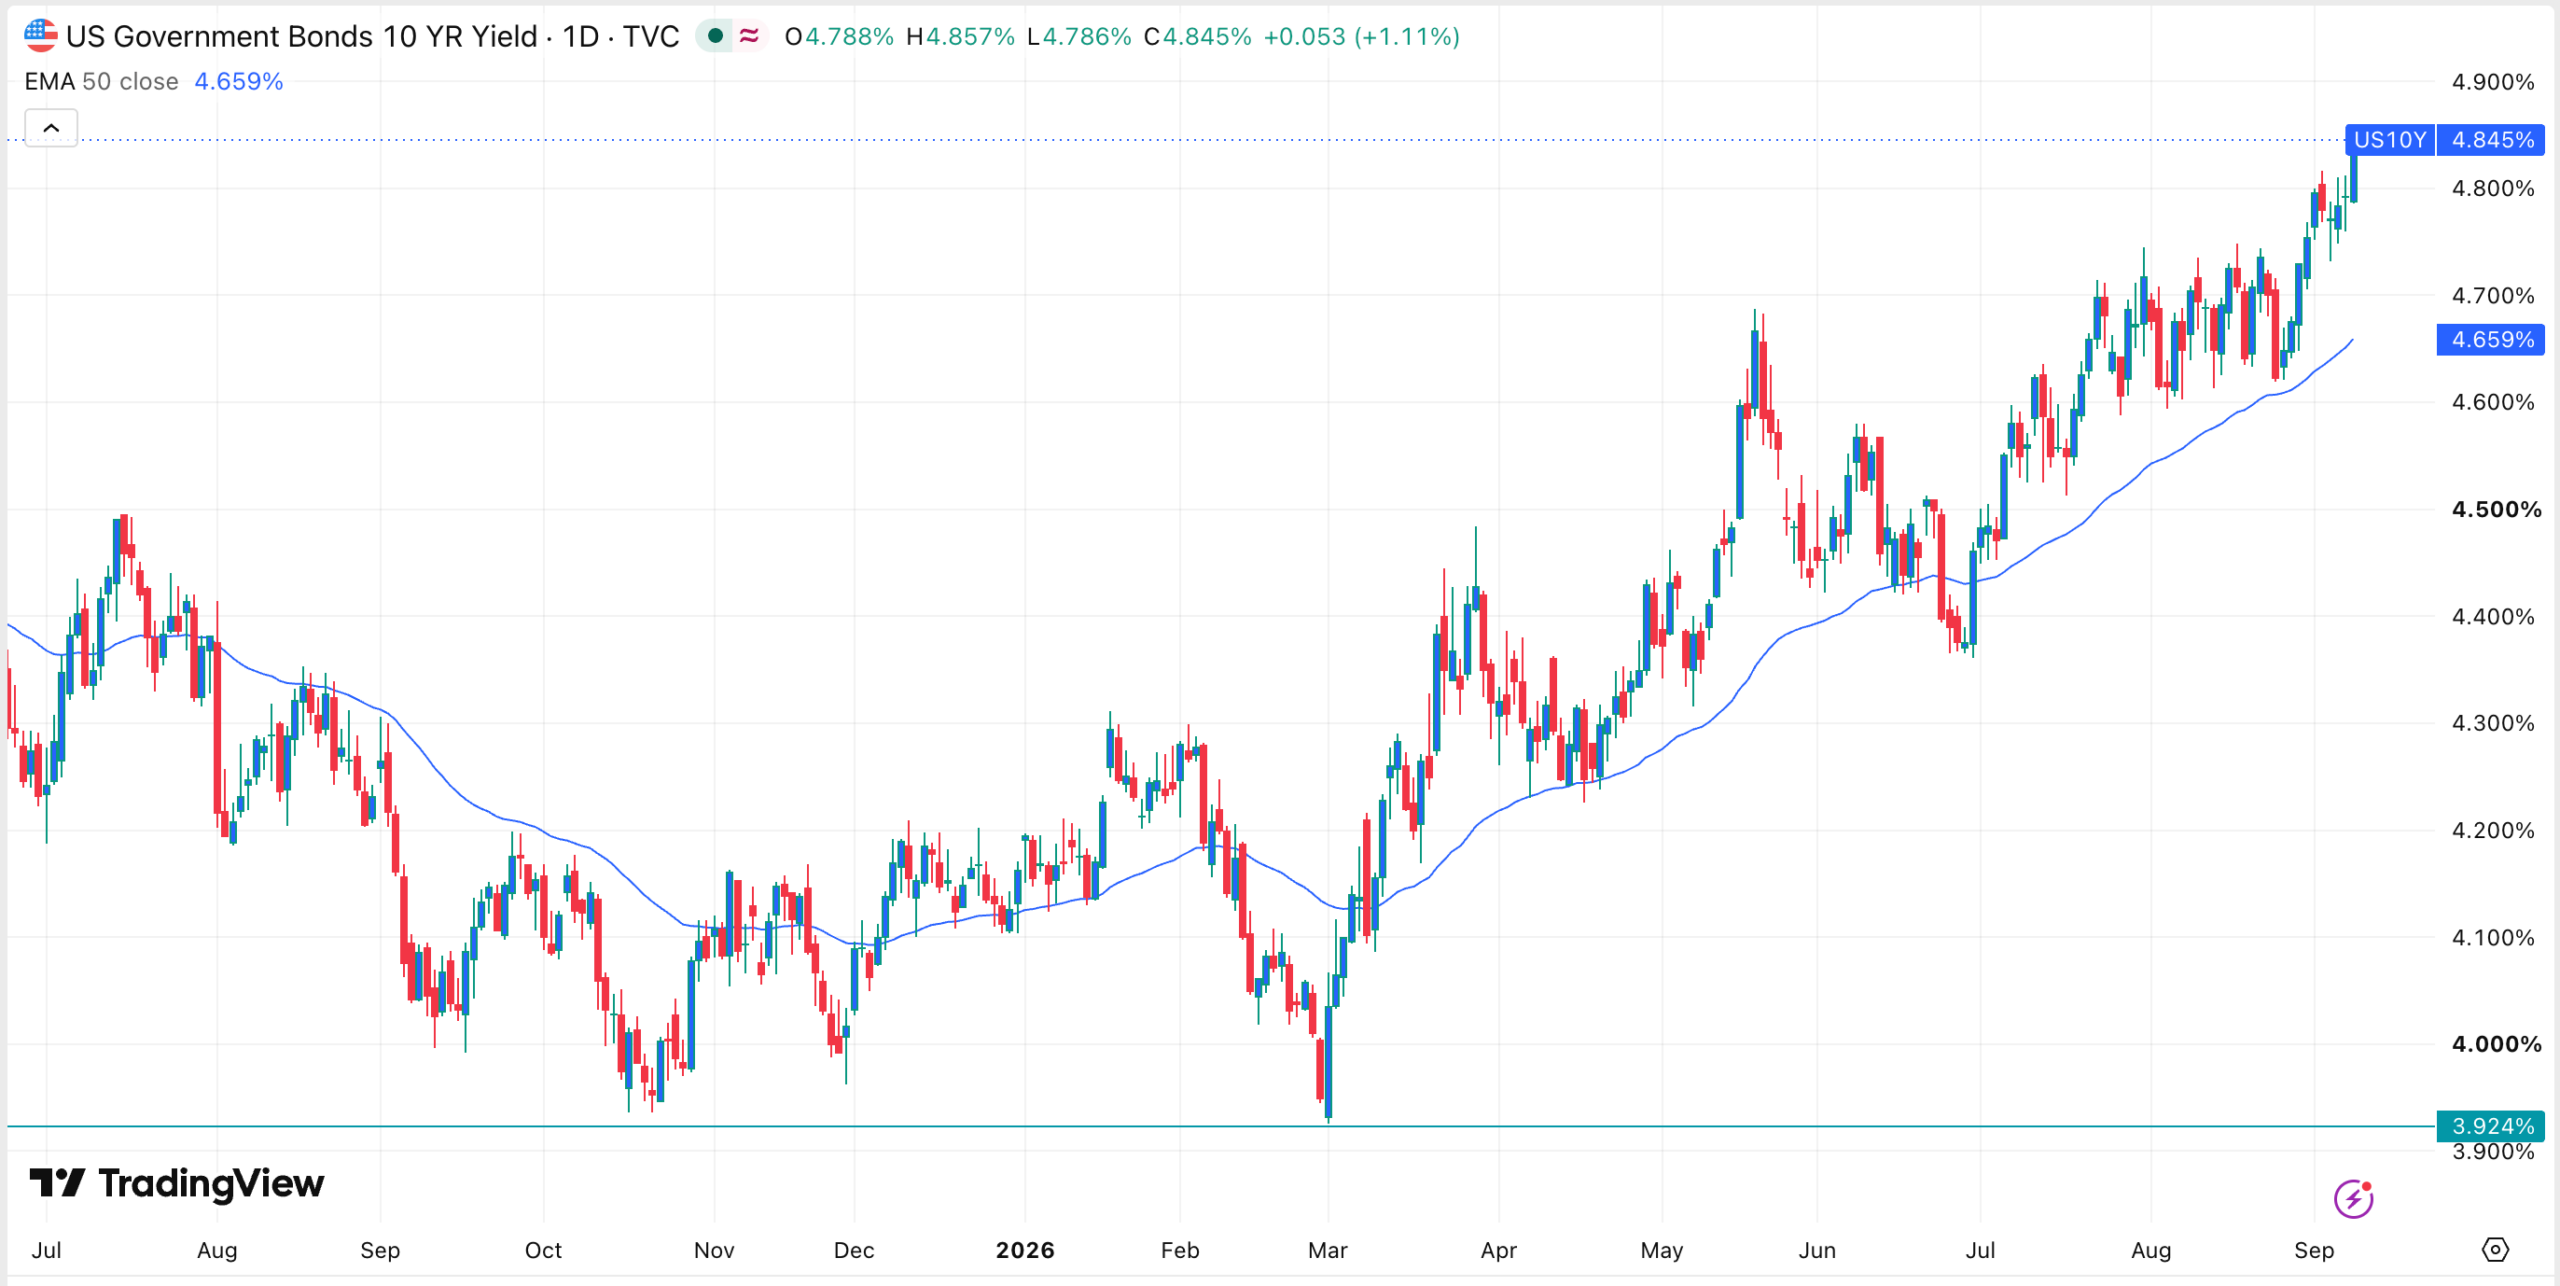
Bitcoin price is also reacting to the ongoing performance of the bond market. Data show that yields have continued to rise, with the ten-year jumping to 4.85%, its highest level since October 2023. It has jumped from a low of 3.924% in March this year.
The same is happening in the longer-term bond market, where the 30-year jumped to 5.29%. This surge continued even after the Treasury Department decided to triple the long-term debt buyback to $6 billion. It hopes that these interventions will help to lower interest rates.
Still, the challenge is that the buybacks have not addressed the core issue, which includes the rising deficits. The US is spending over $7 trillion each year, while raising $5 trillion in taxes. These deficits explain why the US has accumulated over $40 trillion in debt and the figure is continuing to rise.
In theory, these developments are bullish for Bitcoin because of its role as a safe-haven asset. However, in the short term, they will lead to substantial volatility. This explains why spot Bitcoin ETFs lost assets on Tuesday.
Bitcoin Price Technical Analysis
The daily chart shows that the BTC price has remained in a narrow range this week. It has formed an ascending channel and is hovering around its lower side. On the positive side, this channel is part of the formation of a bullish flag pattern.
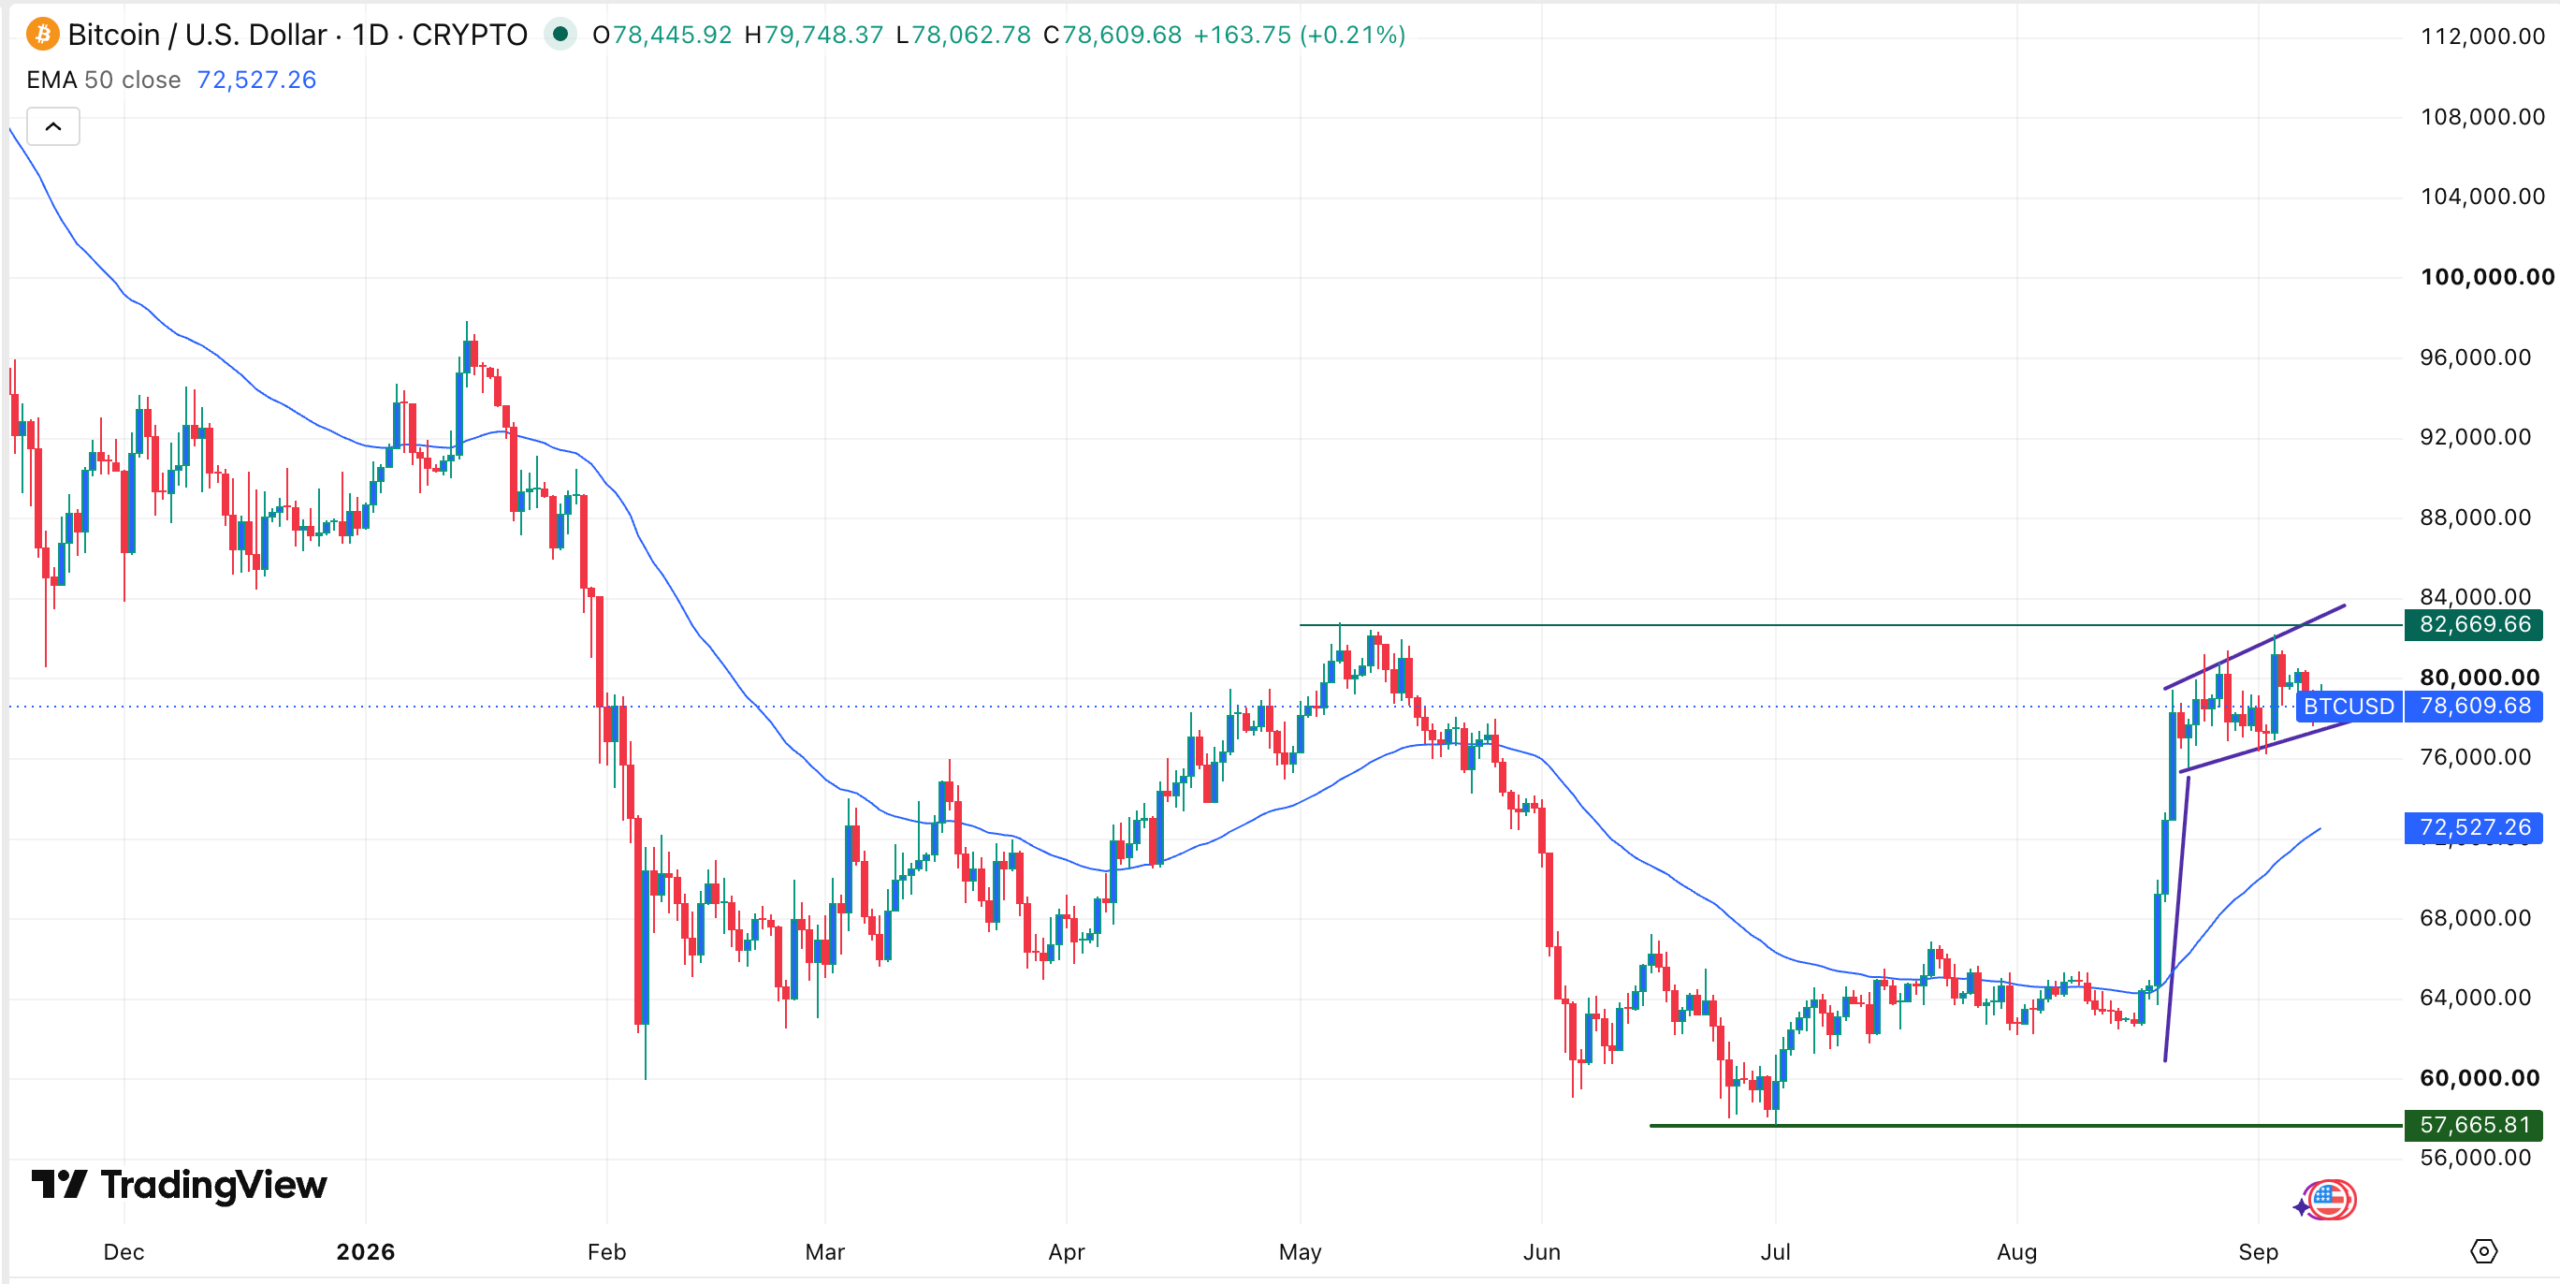
Bitcoin has also jumped above the 200-day moving average, a sign that bulls are in control. Therefore, the coin will likely bounce back in the near term, potentially to the key resistance level of $82,670. On the flip side, a drop below the $76,000 support level will invalidate the bullish view.
This article is for informational purposes only and should not be considered financial or investment advice. Cryptocurrency markets remain highly volatile. Readers should conduct independent research before making investment decisions.



