
 NEAR Protocol
 Pearl
Pearl Bitcoin
 Puffer
 ZKsync
 Pudgy Penguins
 Hyperliquid
- Hedera (HBAR) is currently trading at $0.04888 with an advance of +0.70% in the last 24 hours.
- The current market cap of HBAR coin is $1,574,699,078 with a decline of -1.05% in the last 24 hours.
- Over the last 24 hours, the trading volume of HBAR coin is $22,416,652 following a decline of -9.47% in the last 24 hours.
Hedera (HBAR) is a native token of Hedera which is an enterprise-grade network. HBAR price prediction formed a hammer a few days ago which can result in a decline in price and further continuation of the downtrend.
Hedera (HBAR) is currently trading at the level of $0.04888 with an advance of +0.70% in price resulting in a rise of 0.00040 in the last 24 hours. HBAR started to advance from 16 June 2023 after making a low of 0.04199 and was unable to break further low resulting in the formation of a higher high structure but recently started taking rejection from higher levels.
Hedera (HBAR) Technical Analysis
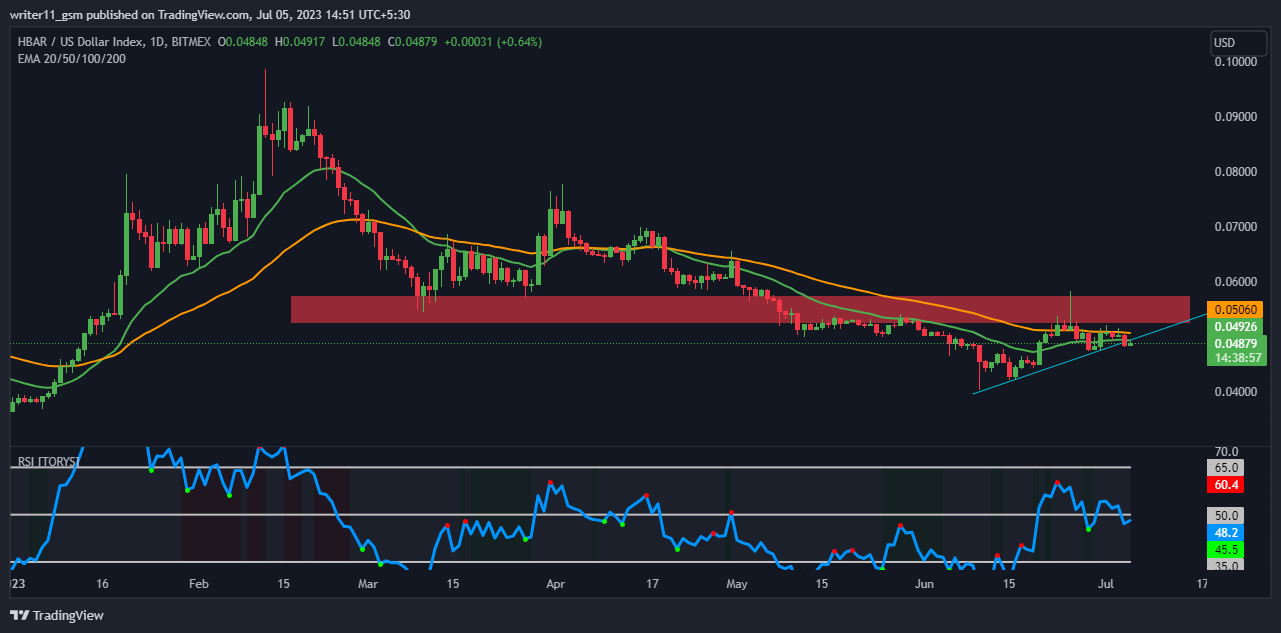
EMA: Hedera (HBAR) currently trading below the 20-day moving average and the 50-day moving average which indicates the weakness and the waning interest of buyers in the market. Hedera (HBAR) spiked from the bottom and breached the 20-day moving average but was unable to subtend above the 20 and 50-day moving averages which resulted in a further decline in the price.
RSI: In Hedera (HBAR) price analysis, the RSI stood up from the oversold zone and broke the level of 50 but failed to sustain above the 50 level and is currently declining from the upper levels which represents further weakness in the market. Also, the RSI is making lower lows from the last few days which represents the weakening strength of the buyers and their losing interest in the market.
Market Structure: HBAR tried to bounce back from the bottom and attempted to make a higher high structure but failed as it took resistance from the higher levels and resulted in making a hammer at the crucial resistance which indicated further weakness in the market.
Conclusion
After looking into the charts of Hedera (HBAR), we can clearly see that the price is underperforming as of now as the RSI is declining and the market is trading under a bearish crossover of 20,50-days moving average and also is sustaining below the moving average. Showing a signs of weakness and lead to price fall in future
Technical Levels
- Support Levels- 0.04464 and 0.04244
- Resistance Levels– 0.05455 and 0.06409
Disclaimer
The information provided in this article, including the views and opinions expressed by the author or any individuals mentioned, is intended for informational purposes only. It is important to note that the article does not provide financial or investment advice. Investing or trading in cryptocurrency assets carries inherent risks and can result in financial loss.




