
 Dacity Coin
 Injective
 Pearl
Pearl Bittensor
 Pudgy Penguins
 Celestia
 NEAR Protocol
- In the last intraday trading session, SMR’s price experienced a significant increase of 22.86%.
- The price is currently retesting its $5.84 resistance level.
NuScale Power Corporation (NYSE: SMR) deals in the commercialization of a modular reactor. The company designs and markets small modular reactors. Its products include VOYGR SMR Plants and Energy Exploration (E2) Centres.
NuScale Power Corporation (SMR) Stock Analysis
SMR’s share price after increasing by 22.86% in its last intraday trading session, is currently trading at $5.75. The current market capitalization of the company is worth 1.138 Billion USD and an average 10-day volume of 2.55 Million.
Price Analysis on 1-Day Chart of SMR Stock
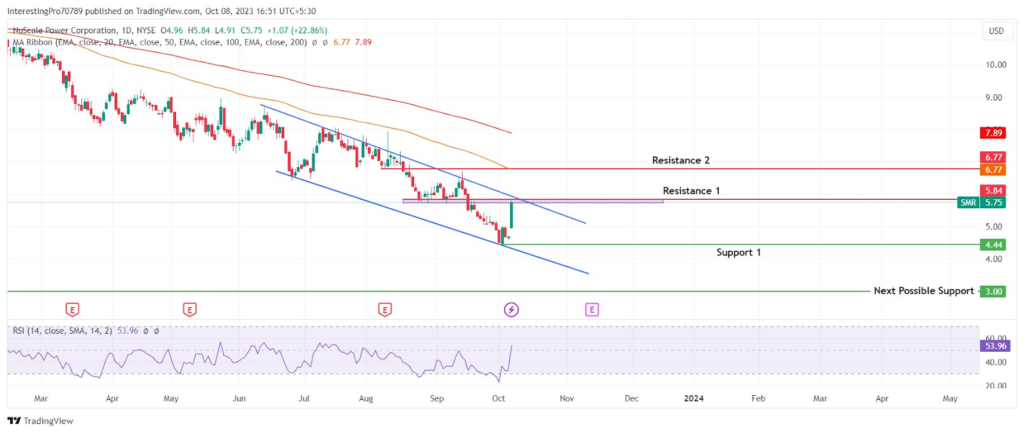
The SMR’s share price is trading inside a falling parallel channel and is retesting its $5.84 level after giving the breakout of this level. In the last trading session, the Price formed a big bullish candle. It closed just below the $5.84 resistance zone.
The 100 and 200 EMA lines are trading above the SMR stock price but are far from it. The price may rise to retest the EMA lines. Only under one condition price could be in bullish sentiment if it closes above both the EMA lines.
The RSI line has recently crossed above its 50 level and is trending in the upward direction. It shows the bullish ongoing activity in the current scenario. However, if the RSI stays above its 50 RSI level and trends in the upside direction, the SMR share price can rise.
In the current scenario, it will be for traders to wait as the price has not given any major confirmation. If the price gives a breakout of the falling parallel channel and $5.84 resistance level and sustains above it, crossing the next resistance at $6.77 will be possible.
However, for the price to continue its downtrend it must form a bearish reversal candle below the $5.84 level. Then it may continue its fall to the $4.44 level. If it also breaks below the $4.44 level, it may fall to its next possible support at $3.00.
Conclusion
The SMR stock has not shown any major confirmation for the future price trend. So, it will be better to wait for the confirmation. If the price gives the breakout of the falling parallel channel and $5.84 level and sustains above it, it may reach its next resistance level at $6.77.
However, for the price to continue its bearish trend it must form a bearish reversal candle below the $5.84 level. Thus, it may fall to its support at $4.44. If it also gives the breakdown of the $4.44, it may fall to its next support at $3.00.
Technical levels
Resistance Levels: $5.84 and $6.77.
Support Levels: $4.44 and $3.00.
Disclaimer
The views and opinions stated by the author or any other person named in this article are for informational purposes only. They do not provide financial, investment, or other advice. Investing or trading comes with a risk of financial loss.



