
 Puffer
 ZKsync
 Pearl
Pearl Bitcoin
 Ondo
Ondo Walrus
 Pudgy Penguins
- The TIA crypto is overbought as per technical indicators.
- The Celestia crypto is trading near its cycle high, indicating a strong uptrend.
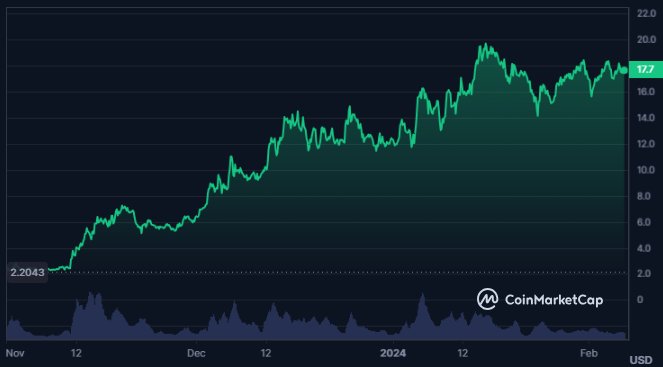
Celestia is a data availability network that enables scalable and independent blockchains. TIA is its native token that pays for data, bootstraps new chains, secures the network, and governs the community. Celestia was founded by Mustafa Al-Bassam and Ismail Khoffi who are experts in blockchain and distributed systems.
The max supply of the Celestia crypto is undefined and its market cap dominance is 0.17%. It is highly volatile with a volatility of 7.62% and the sentiment of the crypto is bullish.
The fear and greed index of the crypto is at 64, indicating greed, and the market cap of the crypto has declined by 0.55% in the last 24 hours. The volume/market cap ratio of the crypto is 4.69% and its circulating supply is 162.3303 Million TIA.
The total supply of the crypto is 1.021 Billion TIA resulting in a fully diluted market cap of $17.997 Billion while the market cap is $2.861 Billion. The trading price of the Celestia crypto has increased by 750% from its all-time low price.
Celestia Crypto Derivatives Analysis
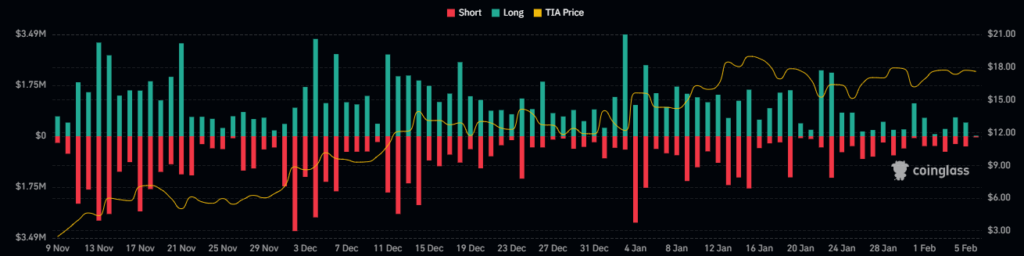
Derivatives data of the Celestia crypto show the bears’ dominance as the crypto has witnessed higher long liquidation of $443.58K while the short liquidation is $320.33K.
The derivatives traded volume has also declined by 2.53% along with a decline of 1.54% in the open interest of the crypto. Additionally, the long/short ratio of the crypto is 0.9841.
TIA Crypto Technical Analysis
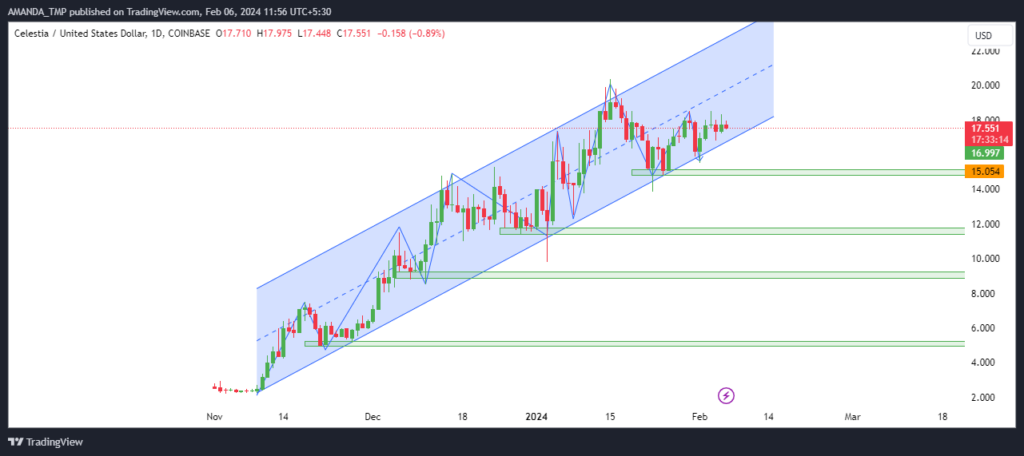
The trading price of the TIA crypto is following a strong uptrend and is consistently rising to higher levels by trading inside a rising wedge pattern.
A strong support of $15.00 can be seen on the charts. If the crypto breaks below this level with a decline below the rising wedge pattern, we might see a bearish change in trend.
TIA/USD Chart by TradingView
The 20-day and the 50-day EMAs are trading flat and the values of both are very close to each other. This behavior of the EMAs indicates the volatility in price and uncertainty in the momentum ahead.
The MACD and the signal lines have overlapped each other and they are above the zero level, which again represents uncertainty in the price.
The RSI is also in a small range and is revolving around the 50 level. The 14-day SMA is also trading flat around the 50-level.
Summary
TIA is overbought and near its cycle high, with high volatility and greed. Derivatives data shows bearish pressure and technical indicators show uncertainty and signs of a possible trend reversal. TIA is risky and unpredictable at the moment.
Disclaimer
This article is for informational purposes only and does not provide any financial, investment, or other advice. The author or any people mentioned in this article are not responsible for any financial loss that may occur from investing in or trading. Please do your research before making any financial decisions.




