
 Bitcoin
 Starknet
 Pearl
Pearl ZKsync
 NEAR Protocol
 Quantus
 Zerebro
- The Terra Classic crypto price has witnessed a huge decline in the last 24 hours.
- The LUNC crypto price has increased by 539% from its all-time low.
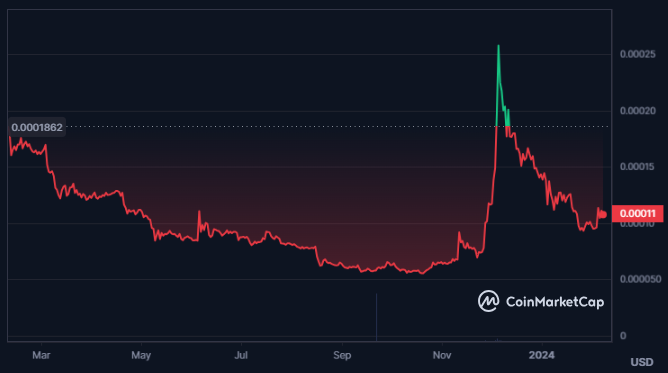
LUNC is the staking and governance token of Terra Classic, a PoS blockchain with stablecoins. It was formerly Luna, before a new Terra chain was created. LUNC still has utility, but its status and future are uncertain.
LUNC is a highly volatile crypto and has a volatility of 10.61% while the supply inflation of the crypto is relatively low at -3.58%. The market cap of the crypto is $621.263 Million resulting in a market cap dominance of 0.04%.
The total supply of the crypto is 6.81 Trillion LUNA and it has a max supply of 6.88 Trillion. Additionally, the fully diluted market cap of the crypto is $732.22 Million. The volume/market cap ratio of the crypto is 7.30% and the traded volume has declined by 43.4%.
The traded volume value for the crypto is $44.259 Million and the Total Value Locked is $3.31 Million and it has a stablecoin market cap of $232.74 Million. Additionally, the total raised amount by the crypto is worth $57 Million.
Terra Classic Crypto Derivatives Analysis
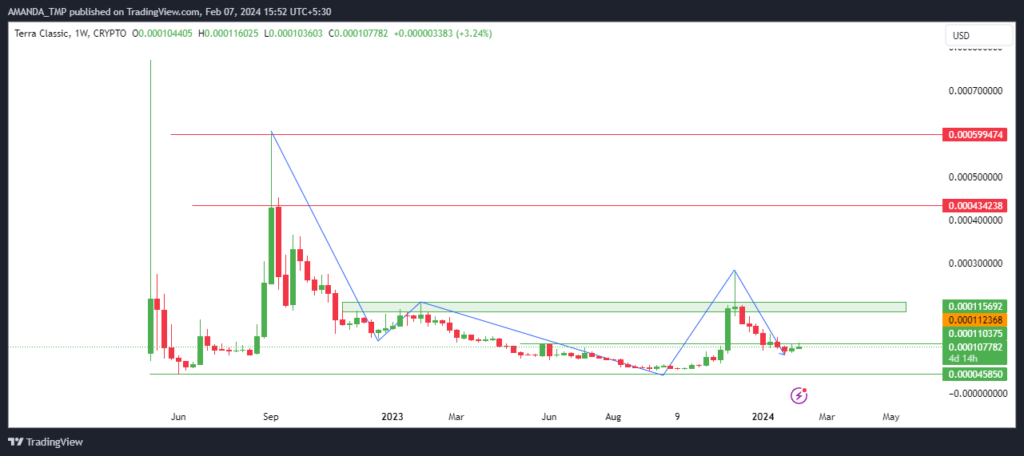
The price of the LUNC crypto is consistently making lower lows on the chart and the price is close to all-time lows. The current behavior of the price shows bearishness and the crypto is also forming a bearish candlestick pattern on the charts.
LUNC/USD Chart by TradingView
The EMAs on the daily chart of the LUNC crypto seem to be reversing to a bearish direction as the price has declined below the 50-day and the 200-day EMAs. The EMAs are also situated close to each other, indicating the possibility of the formation of a bearish cross in the upcoming days.
The MACD and the signal lines are giving a buy signal while the overall scenario of the indicator indicates bearishness. This is because the MACD and the signal lines are situated below the zero level.
The RSI on the daily chart of the LUNC crypto is at a level of 49.28 and has broken above the 14-day SMA. For further bullish confirmation, the RSI needs to break above 50 and sustain above the same.
Summary
LUNC is a volatile and uncertain crypto that has lost momentum and faces resistance. The price is near its all-time lows and shows bearish patterns. The technical indicators are also negative, suggesting the likelihood of further declines ahead.
Disclaimer
This article is for informational purposes only and does not provide any financial, investment, or other advice. The author or any people mentioned in this article are not responsible for any financial loss that may occur from investing in or trading. Please do your research before making any financial decisions.




